## Chart: Gemini-2.0-Flash
### Overview
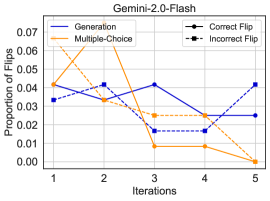
The image is a line chart comparing the proportion of flips across iterations for different methods: Generation, Multiple-Choice, Correct Flip, and Incorrect Flip. The x-axis represents iterations (1 to 5), and the y-axis represents the proportion of flips (0.00 to 0.07).
### Components/Axes
* **Title:** Gemini-2.0-Flash
* **X-axis:** Iterations (1, 2, 3, 4, 5)
* **Y-axis:** Proportion of Flips (0.00, 0.01, 0.02, 0.03, 0.04, 0.05, 0.06, 0.07)
* **Legend:** Located in the top-right corner.
* Generation (solid dark blue line)
* Multiple-Choice (solid orange line)
* Correct Flip (dark blue line with circle markers)
* Incorrect Flip (dark blue dashed line with square markers)
### Detailed Analysis
* **Generation (solid dark blue line):**
* Trend: Initially increases, then decreases, and finally increases again.
* Data Points:
* Iteration 1: ~0.033
* Iteration 2: ~0.042
* Iteration 3: ~0.042
* Iteration 4: ~0.025
* Iteration 5: ~0.025
* **Multiple-Choice (solid orange line):**
* Trend: Initially increases sharply, then decreases sharply, plateaus, and decreases again.
* Data Points:
* Iteration 1: ~0.041
* Iteration 2: ~0.065
* Iteration 3: ~0.025
* Iteration 4: ~0.008
* Iteration 5: ~0.000
* **Correct Flip (dark blue line with circle markers):**
* Trend: Decreases, then plateaus.
* Data Points:
* Iteration 1: ~0.033
* Iteration 2: ~0.033
* Iteration 3: ~0.017
* Iteration 4: ~0.025
* Iteration 5: ~0.025
* **Incorrect Flip (dark blue dashed line with square markers):**
* Trend: Decreases, then increases.
* Data Points:
* Iteration 1: ~0.038
* Iteration 2: ~0.042
* Iteration 3: ~0.017
* Iteration 4: ~0.017
* Iteration 5: ~0.042
### Key Observations
* The Multiple-Choice method shows a significant initial increase in the proportion of flips, followed by a sharp decline.
* The Generation method fluctuates more than the Correct Flip and Incorrect Flip methods.
* The Correct Flip and Incorrect Flip methods are relatively stable after the initial iterations.
### Interpretation
The chart compares the proportion of flips across iterations for different methods. The Multiple-Choice method initially leads to a higher proportion of flips, but this quickly decreases. The Generation method shows more fluctuation, while the Correct Flip and Incorrect Flip methods are more stable. This suggests that the Multiple-Choice method might initially introduce more errors or changes, but these are quickly corrected, leading to a lower proportion of flips in later iterations. The Generation method might be more prone to fluctuations, while the Correct Flip and Incorrect Flip methods might represent a more stable baseline.