## Line Chart: Gemini-2.0-Flash Performance
### Overview
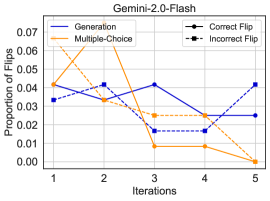
This image presents a line chart illustrating the "Proportion of Flips" across five "Iterations" for different evaluation methods: "Generation", "Multiple-Choice", "Correct Flip", and "Incorrect Flip". The chart appears to track the frequency of changes or adjustments made during an iterative process, likely related to model training or refinement.
### Components/Axes
* **Title:** Gemini-2.0-Flash (top-center)
* **X-axis:** Iterations (labeled 1 to 5, bottom-center)
* **Y-axis:** Proportion of Flips (labeled from 0.00 to 0.07, left-center)
* **Legend:** Located in the top-right corner.
* Generation (Blue solid line)
* Multiple-Choice (Orange solid line)
* Correct Flip (Black dashed line)
* Incorrect Flip (Black dashed-dotted line)
* **Gridlines:** Horizontal and vertical gridlines are present to aid in reading values.
### Detailed Analysis
Let's analyze each line individually, noting trends and approximate data points.
* **Generation (Blue Solid Line):** This line initially slopes downward from Iteration 1 to Iteration 4, then increases slightly in Iteration 5.
* Iteration 1: Approximately 0.042
* Iteration 2: Approximately 0.038
* Iteration 3: Approximately 0.040
* Iteration 4: Approximately 0.028
* Iteration 5: Approximately 0.036
* **Multiple-Choice (Orange Solid Line):** This line exhibits a strong downward trend, decreasing significantly from Iteration 1 to Iteration 5.
* Iteration 1: Approximately 0.062
* Iteration 2: Approximately 0.048
* Iteration 3: Approximately 0.010
* Iteration 4: Approximately 0.010
* Iteration 5: Approximately 0.002
* **Correct Flip (Black Solid Line):** This line shows a relatively stable pattern, with slight fluctuations.
* Iteration 1: Approximately 0.034
* Iteration 2: Approximately 0.032
* Iteration 3: Approximately 0.032
* Iteration 4: Approximately 0.024
* Iteration 5: Approximately 0.032
* **Incorrect Flip (Black Dashed-Dotted Line):** This line generally decreases, with a slight increase in Iteration 5.
* Iteration 1: Approximately 0.016
* Iteration 2: Approximately 0.014
* Iteration 3: Approximately 0.012
* Iteration 4: Approximately 0.012
* Iteration 5: Approximately 0.018
### Key Observations
* The "Multiple-Choice" method shows the most significant decrease in the "Proportion of Flips" over the iterations, suggesting rapid convergence or stabilization.
* The "Generation" method exhibits a more gradual decrease, with a slight increase in the final iteration.
* "Correct Flip" and "Incorrect Flip" remain relatively stable throughout the iterations.
* The "Incorrect Flip" proportion is consistently lower than the "Correct Flip" proportion.
### Interpretation
The chart suggests that the Gemini-2.0-Flash model is undergoing an iterative refinement process. The "Proportion of Flips" likely represents the frequency of parameter adjustments or changes made to the model during each iteration. The rapid decrease in "Multiple-Choice" flips indicates that this evaluation method quickly leads to a stable state, potentially because it's a simpler task. The more gradual change in "Generation" suggests that generating text is a more complex process requiring more iterations to refine. The relatively stable "Correct Flip" and "Incorrect Flip" proportions suggest that the model is consistently making a certain number of correct and incorrect adjustments, and this balance doesn't change dramatically over the iterations. The slight increase in "Incorrect Flip" in Iteration 5 could indicate a potential instability or a need for further refinement. Overall, the data suggests that the model is improving with each iteration, but the rate of improvement varies depending on the evaluation method used.