## Line Chart: Gemini-2.0-Flash Proportions Over Iterations
### Overview
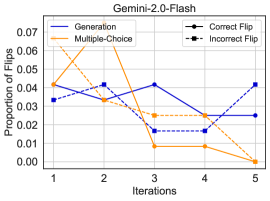
The image is a line chart titled "Gemini-2.0-Flash" that plots the "Proportion of Flips" against "Iterations" (from 1 to 5). It compares two primary methods, "Generation" and "Multiple-Choice," each broken down into "Correct Flip" and "Incorrect Flip" sub-categories. The chart visualizes how the frequency of these flip events changes over five iterative steps.
### Components/Axes
* **Title:** "Gemini-2.0-Flash" (centered at the top).
* **Y-Axis:** Label is "Proportion of Flips." Scale ranges from 0.00 to 0.07, with major tick marks at 0.01 intervals.
* **X-Axis:** Label is "Iterations." Discrete integer markers from 1 to 5.
* **Legend:** Located in the top-right corner of the plot area. It defines four data series:
* **Generation - Correct Flip:** Solid blue line with circular markers.
* **Generation - Incorrect Flip:** Dashed blue line with square markers.
* **Multiple-Choice - Correct Flip:** Solid orange line with circular markers.
* **Multiple-Choice - Incorrect Flip:** Dashed orange line with square markers.
### Detailed Analysis
The chart tracks four distinct data series across five iterations. Values are approximate, read from the chart's grid.
**1. Generation - Correct Flip (Solid Blue Line, Circles)**
* **Trend:** Rises to a peak at iteration 2, then declines steadily.
* **Data Points (Approx.):**
* Iteration 1: 0.033
* Iteration 2: 0.042 (Peak)
* Iteration 3: 0.025
* Iteration 4: 0.025
* Iteration 5: 0.025
**2. Generation - Incorrect Flip (Dashed Blue Line, Squares)**
* **Trend:** Shows a general downward trend, reaching zero by the final iteration.
* **Data Points (Approx.):**
* Iteration 1: 0.045
* Iteration 2: 0.033
* Iteration 3: 0.017
* Iteration 4: 0.017
* Iteration 5: 0.000
**3. Multiple-Choice - Correct Flip (Solid Orange Line, Circles)**
* **Trend:** Declines sharply from the start, reaching zero by iteration 5.
* **Data Points (Approx.):**
* Iteration 1: 0.045
* Iteration 2: 0.033
* Iteration 3: 0.008
* Iteration 4: 0.008
* Iteration 5: 0.000
**4. Multiple-Choice - Incorrect Flip (Dashed Orange Line, Squares)**
* **Trend:** Decreases initially, hits a low at iteration 4, then shows a sharp increase at iteration 5.
* **Data Points (Approx.):**
* Iteration 1: 0.045
* Iteration 2: 0.033
* Iteration 3: 0.025
* Iteration 4: 0.017 (Lowest Point)
* Iteration 5: 0.042 (Sharp Increase)
### Key Observations
1. **Convergence to Zero:** Both "Correct Flip" series (Generation and Multiple-Choice) and the "Generation - Incorrect Flip" series trend toward or reach a proportion of 0.000 by iteration 5.
2. **Divergent Final Behavior:** The "Multiple-Choice - Incorrect Flip" series is the only one that does not end at or near zero. Instead, it exhibits a significant upward spike between iterations 4 and 5, nearly returning to its starting value.
3. **Peak Timing:** The "Generation - Correct Flip" series peaks early (iteration 2), while the "Multiple-Choice - Incorrect Flip" series has its lowest point at iteration 4 before spiking.
4. **Initial Similarity:** At iteration 1, three of the four series (Generation Incorrect, Multiple-Choice Correct, Multiple-Choice Incorrect) start at approximately the same proportion (~0.045).
### Interpretation
This chart likely illustrates the performance or behavior of a model (Gemini-2.0-Flash) during an iterative process, such as refinement, training, or a multi-step evaluation. "Flips" may refer to changes in model output, predictions, or decisions between steps.
* **What the data suggests:** The general downward trend for "Correct Flips" indicates that as iterations progress, the model makes fewer *correct* changes to its state or outputs. This could imply stabilization or convergence. The trend for "Incorrect Flips" is more complex. For the "Generation" method, incorrect changes also diminish to zero, suggesting the process becomes stable and error-free. However, for the "Multiple-Choice" method, the late spike in incorrect flips is a critical anomaly. It suggests that in the final iteration, this method experiences a resurgence of erroneous changes, potentially indicating instability, over-correction, or a failure mode specific to that method's logic in later stages.
* **Relationship between elements:** The chart directly compares two methodologies ("Generation" vs. "Multiple-Choice") across two outcome types ("Correct" vs. "Incorrect"). The key relationship is the divergent final behavior of the "Multiple-Choice - Incorrect Flip" series compared to all others, highlighting a potential weakness or different characteristic of that approach.
* **Notable anomaly:** The sharp increase in "Multiple-Choice - Incorrect Flip" from ~0.017 at iteration 4 to ~0.042 at iteration 5 is the most significant outlier. This reversal of trend warrants investigation into what occurs in the final step of the Multiple-Choice process.