## Line Chart: Gemini-2.0-Flash
### Overview
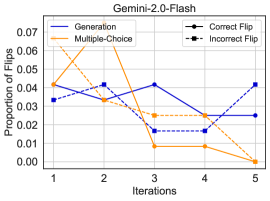
The chart visualizes the proportion of "flips" (changes in model outputs) across five iterations for two methods: "Generation" (blue solid line) and "Multiple-Choice" (orange dashed line). A legend distinguishes "Correct Flip" (solid lines) and "Incorrect Flip" (dashed lines), though the chart does not explicitly separate these subcategories within the data series.
### Components/Axes
- **X-axis (Iterations)**: Labeled "Iterations" with discrete values 1–5.
- **Y-axis (Proportion of Flips)**: Labeled "Proportion of Flips" with a scale from 0.00 to 0.07.
- **Legend**: Located in the top-right corner, with:
- **Correct Flip**: Solid line (black).
- **Incorrect Flip**: Dashed line (black).
- **Data Series**:
- **Generation**: Blue solid line.
- **Multiple-Choice**: Orange dashed line.
### Detailed Analysis
1. **Generation (Blue Solid Line)**:
- Iteration 1: ~0.035.
- Iteration 2: Peaks at ~0.042.
- Iteration 3: Drops to ~0.018.
- Iteration 4: Rises to ~0.042.
- Iteration 5: Stabilizes at ~0.042.
- **Trend**: Fluctuates but remains relatively stable, with a slight upward trend toward the end.
2. **Multiple-Choice (Orange Dashed Line)**:
- Iteration 1: Starts at ~0.042.
- Iteration 2: Spikes sharply to ~0.065.
- Iteration 3: Plummets to ~0.025.
- Iteration 4: Remains flat at ~0.025.
- Iteration 5: Drops to ~0.000.
- **Trend**: High volatility, with a dramatic decline after iteration 2.
### Key Observations
- The **Multiple-Choice** method exhibits extreme volatility, with a peak in iteration 2 (~0.065) and near-zero flips by iteration 5.
- The **Generation** method shows moderate fluctuations but maintains a higher baseline proportion of flips (~0.035–0.042) across iterations.
- The legend’s "Correct Flip" and "Incorrect Flip" labels are not visually distinguishable in the chart, as both data series use solid/black lines without explicit subcategory differentiation.
### Interpretation
The data suggests that the **Multiple-Choice** method initially experiences a high rate of flips (possibly due to exploratory adjustments) but stabilizes or converges to near-zero flips by iteration 5. In contrast, the **Generation** method maintains a consistent proportion of flips, indicating a more stable but less adaptive behavior. The absence of explicit "Correct Flip" vs. "Incorrect Flip" subcategories in the chart limits direct interpretation of error rates, though the legend implies these distinctions exist in the underlying data. The sharp decline in Multiple-Choice flips may reflect model convergence or reduced uncertainty in later iterations.