## Flowchart Diagram: Process Flow with Three Sections
### Overview
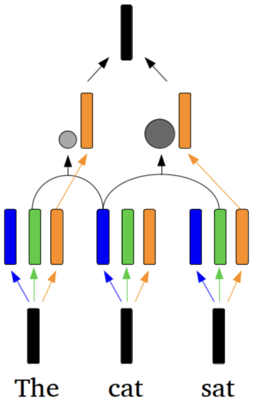
The image depicts a three-section flowchart with labeled components ("The," "cat," "sat") at the bottom. Each section contains three vertical bars (blue, green, orange) and a gray circular element positioned above the orange bar. Arrows connect elements between sections, with black arrows linking the topmost black bar to the orange bars in each section, and orange arrows connecting the gray circles to the orange bars. Blue and green arrows originate from the bottom of each section, pointing upward toward the black bar.
### Components/Axes
- **Labels**:
- Bottom labels: "The" (left), "cat" (center), "sat" (right).
- **Bars**:
- Each section has three vertical bars:
- Blue (leftmost)
- Green (middle)
- Orange (rightmost)
- **Circles**:
- Gray circular elements positioned above the orange bars in each section.
- **Arrows**:
- Black arrows: From the topmost black bar to the orange bars in each section.
- Orange arrows: From gray circles to orange bars.
- Blue/green arrows: From the bottom of each section to the top black bar.
### Detailed Analysis
- **Section Structure**:
- All three sections ("The," "cat," "sat") share identical bar configurations (blue, green, orange) and circular element placement.
- Gray circles are consistently aligned above the orange bars across all sections.
- **Arrow Connections**:
- Black arrows originate from the topmost black bar and point to the orange bars in each section, suggesting a top-down influence or dependency.
- Orange arrows link gray circles to orange bars, implying a direct relationship between the circles and the orange bars.
- Blue/green arrows from the bottom of each section point upward to the black bar, indicating a bottom-up flow or input.
### Key Observations
1. **Symmetry**: All sections mirror each other in bar color order and circular element placement.
2. **Circular Elements**: Gray circles are exclusively associated with orange bars, suggesting a specific functional relationship.
3. **Arrow Directionality**:
- Top-down (black arrows) and bottom-up (blue/green arrows) flows coexist.
- Orange arrows create a localized connection between circles and orange bars.
### Interpretation
This flowchart likely represents a cyclical or iterative process where:
- The three sections ("The," "cat," "sat") correspond to stages or entities in a system.
- The gray circles may represent external inputs, triggers, or constraints affecting the orange bars (e.g., critical decision points).
- The consistent structure across sections implies a template or standardized workflow.
- The bidirectional arrows (top-down and bottom-up) suggest feedback loops or interdependencies between stages.
No numerical data or quantitative trends are present. The diagram emphasizes structural relationships and directional flows rather than measurable values.