## Diagram: Hierarchical Data Processing
### Overview
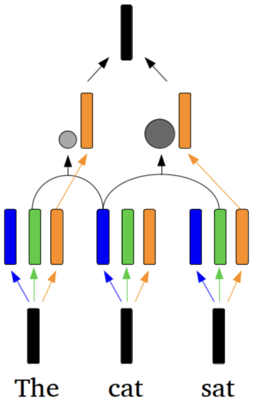
The image is a diagram illustrating a hierarchical data processing flow, likely representing a simplified model of natural language processing or feature extraction. It shows how individual elements ("The", "cat", "sat") are processed through multiple layers to produce a final, aggregated representation.
### Components/Axes
* **Input Layer (Bottom)**: Three vertical black bars labeled "The", "cat", and "sat".
* **First Processing Layer**: Each input bar is connected to a set of three colored bars (blue, green, orange) above it.
* **Second Processing Layer**: The colored bars from the first layer are combined and processed into orange bars with gray circles on top.
* **Output Layer (Top)**: The final output is a single vertical black bar.
* **Arrows**: Arrows indicate the direction of data flow and processing.
### Detailed Analysis
* **Input Layer**:
* "The": Connected to a blue, green, and orange bar in the first processing layer.
* "cat": Connected to a blue, green, and orange bar in the first processing layer.
* "sat": Connected to a blue, green, and orange bar in the first processing layer.
* **First Processing Layer**:
* Each set of three colored bars (blue, green, orange) receives input from one of the input words.
* **Second Processing Layer**:
* The first set of colored bars ("The") and the second set of colored bars ("cat") are combined into an orange bar with a small gray circle on top.
* The second set of colored bars ("cat") and the third set of colored bars ("sat") are combined into an orange bar with a large gray circle on top.
* **Output Layer**:
* The two orange bars with gray circles are combined into a single black bar at the top.
* **Arrows**:
* Blue arrows connect the input words to the blue bars in the first processing layer.
* Green arrows connect the input words to the green bars in the first processing layer.
* Orange arrows connect the input words to the orange bars in the first processing layer.
* Black arrows connect the orange bars with gray circles to the final output bar.
### Key Observations
* The diagram shows a hierarchical structure where individual inputs are processed through multiple layers to produce a final output.
* The colored bars in the first processing layer likely represent different features or aspects of the input words.
* The gray circles in the second processing layer may represent the relative importance or weight of the combined features.
* The size of the gray circles varies, suggesting that different combinations of features have different levels of importance.
### Interpretation
The diagram likely represents a simplified model of natural language processing, where individual words are processed through multiple layers to extract features and combine them into a final representation. The different colors and sizes of the circles may represent different types of features and their relative importance. The hierarchical structure allows the model to learn complex relationships between words and their features. The diagram suggests that the relationship between "cat" and "sat" is more significant than the relationship between "The" and "cat", as indicated by the larger gray circle. This could be due to semantic or syntactic relationships between the words.