## Line Graphs: Success Rate vs. Final Correlation by δ = n/d and m Values
### Overview
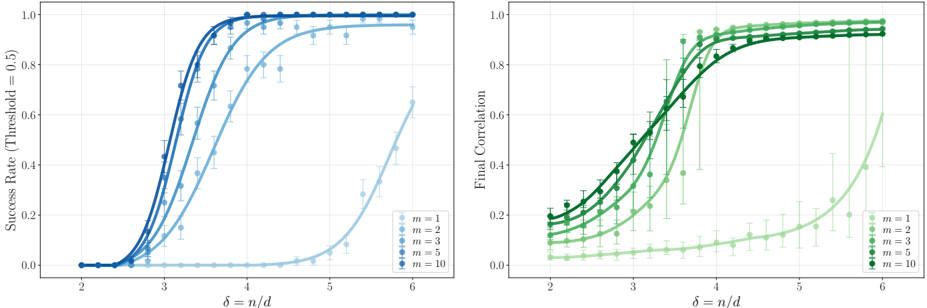
The image contains two side-by-side line graphs comparing performance metrics (Success Rate and Final Correlation) across varying values of δ = n/d (x-axis) and m (legend parameter). Both graphs show sigmoidal trends with error bars, indicating statistical variability. The left graph focuses on success rates at a fixed threshold (0.5), while the right graph measures final correlation values.
---
### Components/Axes
**Left Graph (Success Rate):**
- **X-axis**: δ = n/d (ranges from 2 to 6, labeled in increments of 1)
- **Y-axis**: Success Rate (Threshold = 0.5) (ranges from 0.0 to 1.0, labeled in increments of 0.2)
- **Legend**: Positioned at bottom-right, with m values (1, 2, 3, 5, 10) mapped to light-to-dark blue gradients.
- **Lines**: 5 curves (one per m value), all starting near 0 and plateauing near 1.0.
**Right Graph (Final Correlation):**
- **X-axis**: δ = n/d (same scale as left graph)
- **Y-axis**: Final Correlation (ranges from 0.0 to 1.0, labeled in increments of 0.2)
- **Legend**: Positioned at bottom-right, with m values (1, 2, 3, 5, 10) mapped to light-to-dark green gradients.
- **Lines**: 5 curves (one per m value), all starting near 0 and plateauing near 1.0.
---
### Detailed Analysis
**Left Graph (Success Rate):**
- **m = 1**: Light blue line. Success rate rises sharply after δ ≈ 3.5, reaching ~0.95 by δ = 5.5. Error bars (±0.05–0.1) are largest at δ = 3–4.
- **m = 2**: Medium blue line. Reaches ~0.9 by δ = 4, plateauing at ~0.95 by δ = 5. Error bars smaller than m = 1.
- **m = 3**: Dark blue line. Achieves ~0.85 by δ = 3.5, plateauing at ~0.95 by δ = 4.5. Error bars minimal.
- **m = 5**: Very dark blue line. Reaches ~0.9 by δ = 3, plateauing at ~0.98 by δ = 4. Error bars negligible.
- **m = 10**: Darkest blue line. Peaks at ~0.95 by δ = 3, plateauing at ~0.99 by δ = 4. Error bars smallest.
**Right Graph (Final Correlation):**
- **m = 1**: Light green line. Correlation rises slowly, reaching ~0.8 by δ = 5.5. Error bars largest at δ = 3–4.
- **m = 2**: Medium green line. Achieves ~0.75 by δ = 4.5, plateauing at ~0.9 by δ = 5. Error bars moderate.
- **m = 3**: Dark green line. Reaches ~0.7 by δ = 4, plateauing at ~0.9 by δ = 5. Error bars smaller than m = 2.
- **m = 5**: Very dark green line. Peaks at ~0.8 by δ = 4, plateauing at ~0.95 by δ = 5. Error bars minimal.
- **m = 10**: Darkest green line. Achieves ~0.85 by δ = 4, plateauing at ~0.98 by δ = 5. Error bars smallest.
---
### Key Observations
1. **Inverse Relationship**: Higher m values achieve higher performance metrics (success rate/correlation) at lower δ values. For example:
- m = 10 reaches ~0.95 success rate at δ = 3.5 (left graph), while m = 1 requires δ = 5.5.
- m = 10 achieves ~0.98 final correlation at δ = 5 (right graph), while m = 1 only reaches ~0.8.
2. **Plateau Behavior**: All lines asymptotically approach 1.0, but higher m values plateau earlier.
3. **Error Trends**: Larger error bars for lower m values (e.g., m = 1–2) at δ = 3–4, suggesting greater variability in smaller systems.
---
### Interpretation
The data demonstrates that increasing the parameter **m** improves system performance (success rate and final correlation) at lower δ values. This suggests:
- **Efficiency Trade-off**: Higher m reduces the required δ to achieve high performance, but may involve computational or resource costs.
- **Threshold Sensitivity**: The fixed threshold of 0.5 in the left graph highlights m's role in surpassing critical performance benchmarks.
- **Scalability**: Systems with higher m values are more robust to variations in δ, as evidenced by smaller error bars and earlier plateaus.
These trends imply that optimizing **m** is critical for balancing performance and resource constraints in systems governed by δ = n/d.