## Bar Chart: Average Attention Intensity per Input Prompt Token
### Overview
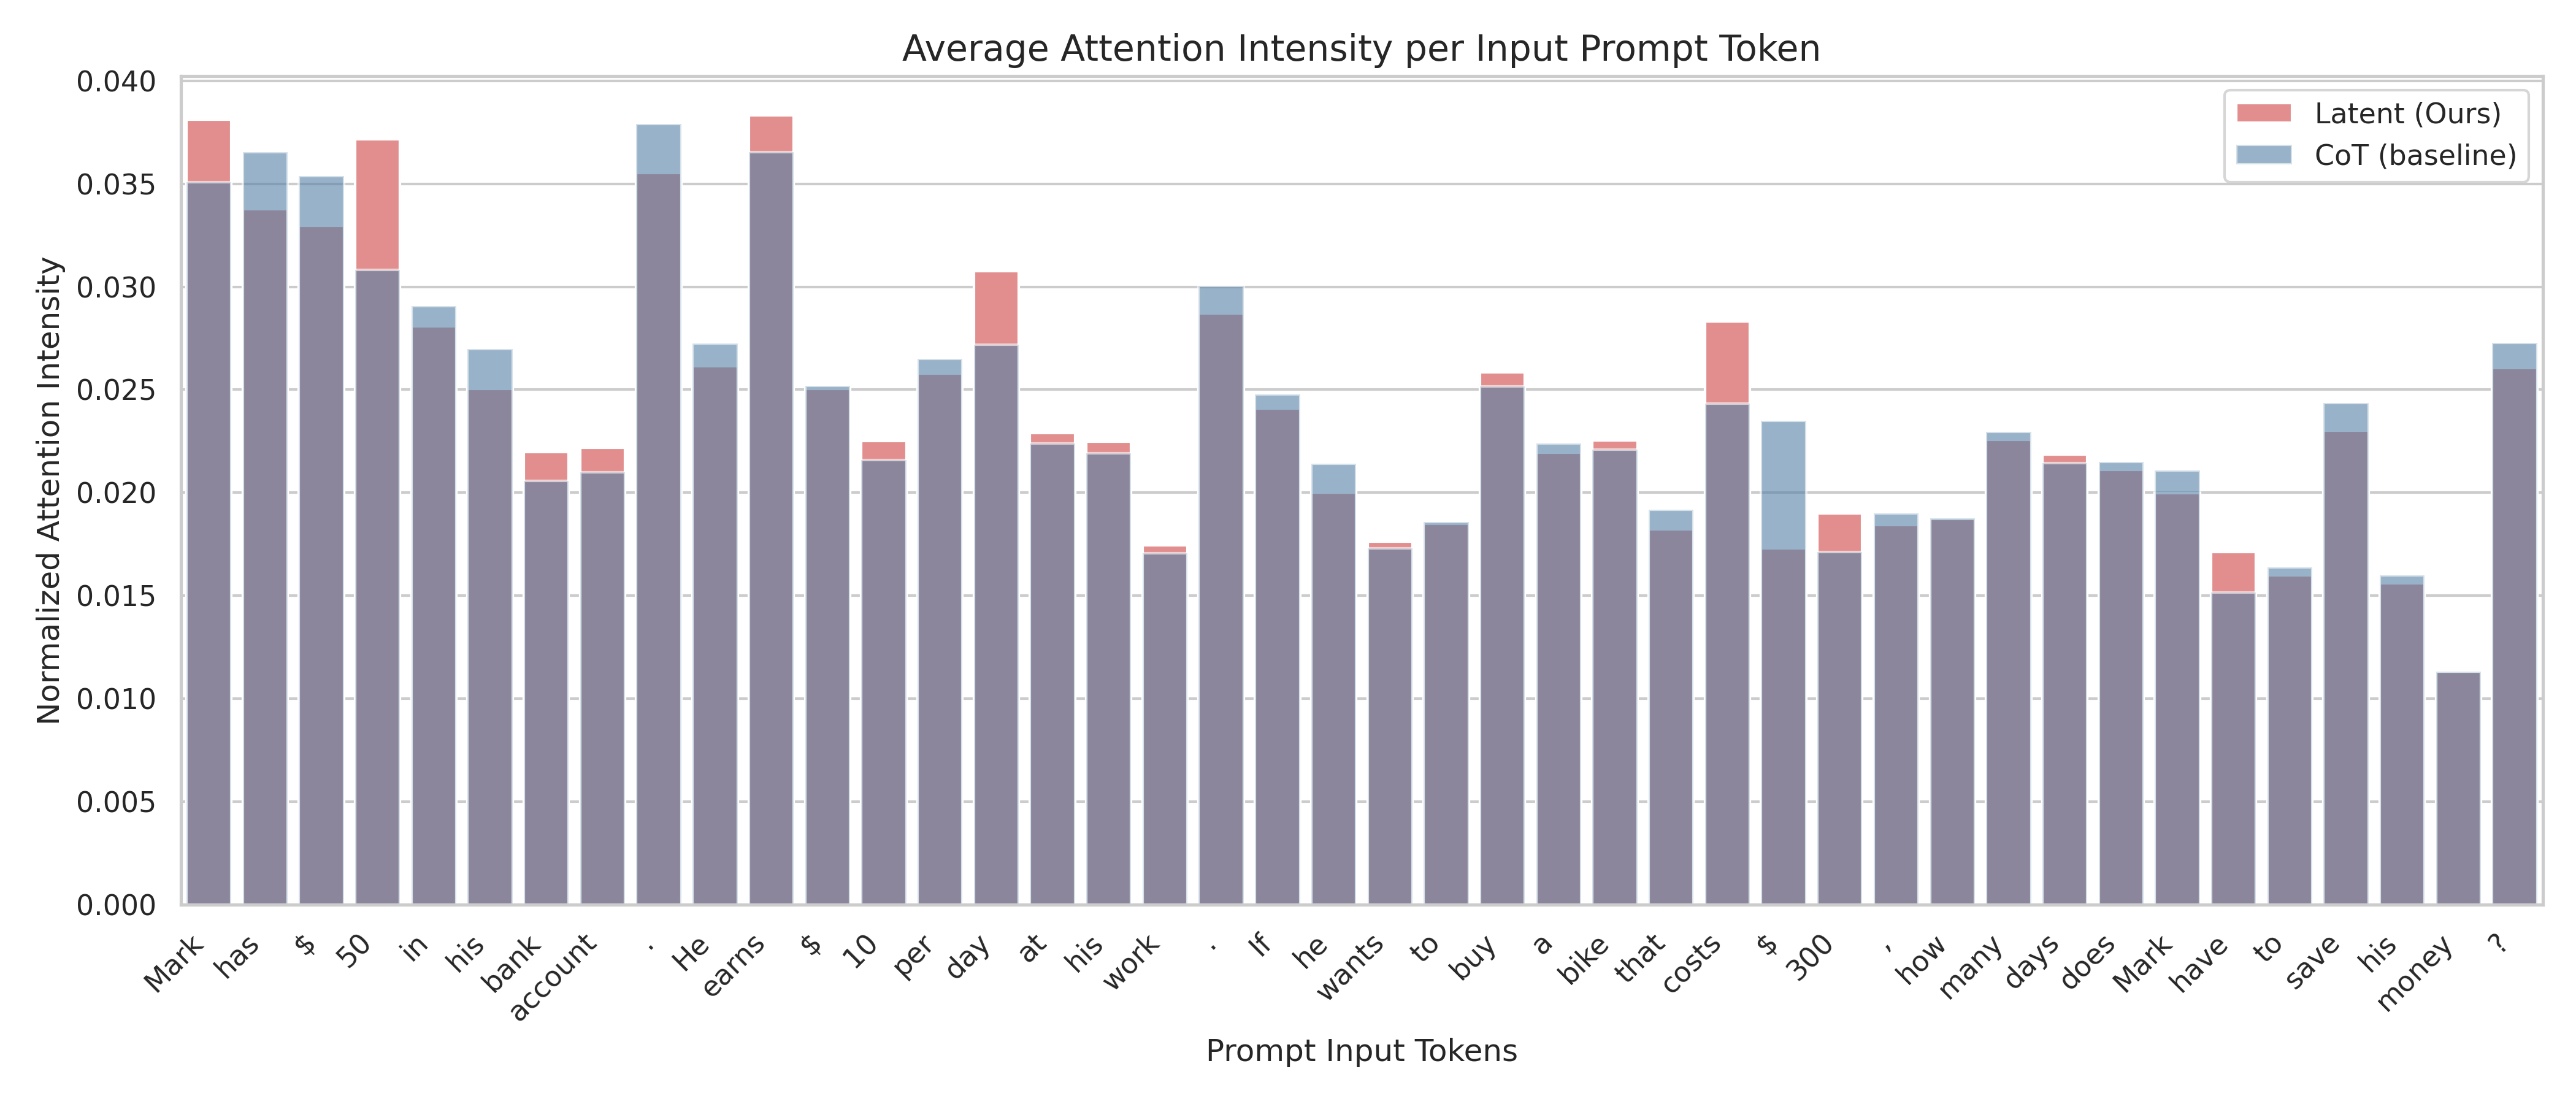
The image is a bar chart comparing the average attention intensity per input prompt token for two different models: "Latent (Ours)" and "CoT (baseline)". The x-axis represents the prompt input tokens, and the y-axis represents the normalized attention intensity. The chart displays the attention intensity for each token in the prompt, allowing for a comparison of how the two models focus on different parts of the input.
### Components/Axes
* **Title:** Average Attention Intensity per Input Prompt Token
* **X-axis:** Prompt Input Tokens. The tokens are: Mark, has, \$, 50, in, his, bank, account, ., He, earns, \$, 10, per, day, at, his, work, If, he, wants, to, buy, a, bike, that, costs, \$, 300, ',', how, many, days, does, Mark, have, to, save, his, money, ?
* **Y-axis:** Normalized Attention Intensity, ranging from 0.000 to 0.040 in increments of 0.005.
* **Legend:** Located in the top-right corner.
* Latent (Ours) - Represented by light red bars.
* CoT (baseline) - Represented by light blue bars.
### Detailed Analysis
The chart presents a bar for each token in the input prompt, with each bar split into two components: a light red portion representing the "Latent (Ours)" model's attention intensity and a light blue portion representing the "CoT (baseline)" model's attention intensity. The total height of each bar indicates the combined attention intensity for that token.
Here's a breakdown of the approximate attention intensity for each token, separated by model:
| Token | Latent (Ours) | CoT (baseline) |
| ----------- | ----------- | ----------- |
| Mark | ~0.005 | ~0.035 |
| has | ~0.005 | ~0.033 |
| \$ | ~0.005 | ~0.030 |
| 50 | ~0.008 | ~0.021 |
| in | ~0.002 | ~0.027 |
| his | ~0.000 | ~0.022 |
| bank | ~0.000 | ~0.038 |
| account | ~0.002 | ~0.036 |
| . | ~0.000 | ~0.027 |
| He | ~0.000 | ~0.026 |
| earns | ~0.000 | ~0.022 |
| \$ | ~0.008 | ~0.014 |
| 10 | ~0.000 | ~0.023 |
| per | ~0.000 | ~0.022 |
| day | ~0.008 | ~0.022 |
| at | ~0.000 | ~0.017 |
| his | ~0.000 | ~0.024 |
| work | ~0.002 | ~0.018 |
| If | ~0.000 | ~0.022 |
| he | ~0.000 | ~0.022 |
| wants | ~0.004 | ~0.022 |
| to | ~0.000 | ~0.019 |
| buy | ~0.002 | ~0.017 |
| a | ~0.000 | ~0.021 |
| bike | ~0.000 | ~0.021 |
| that | ~0.000 | ~0.021 |
| costs | ~0.000 | ~0.017 |
| \$ | ~0.008 | ~0.008 |
| 300 | ~0.002 | ~0.014 |
| , | ~0.000 | ~0.016 |
| how | ~0.000 | ~0.016 |
| many | ~0.000 | ~0.023 |
| days | ~0.000 | ~0.016 |
| does | ~0.000 | ~0.016 |
| Mark | ~0.000 | ~0.027 |
### Key Observations
* The "CoT (baseline)" model generally has a higher attention intensity across most tokens compared to the "Latent (Ours)" model.
* The "Latent (Ours)" model shows increased attention intensity for specific tokens like "50", "\$", "day", and "\$".
* The attention intensity varies significantly across different tokens, indicating that both models focus on specific parts of the input prompt.
### Interpretation
The chart suggests that the "CoT (baseline)" model distributes its attention more evenly across the input prompt tokens, while the "Latent (Ours)" model focuses its attention on a smaller subset of tokens. The tokens that the "Latent (Ours)" model focuses on, such as numerical values ("50", "\$", "300") and time-related words ("day"), might indicate that this model is more sensitive to specific types of information within the prompt. The differences in attention intensity between the two models could be related to their underlying architectures or training objectives. The "Latent (Ours)" model may be employing a strategy that involves focusing on key pieces of information to achieve its task.