## Bar Chart: Average Attention Intensity per Input Prompt Token
### Overview
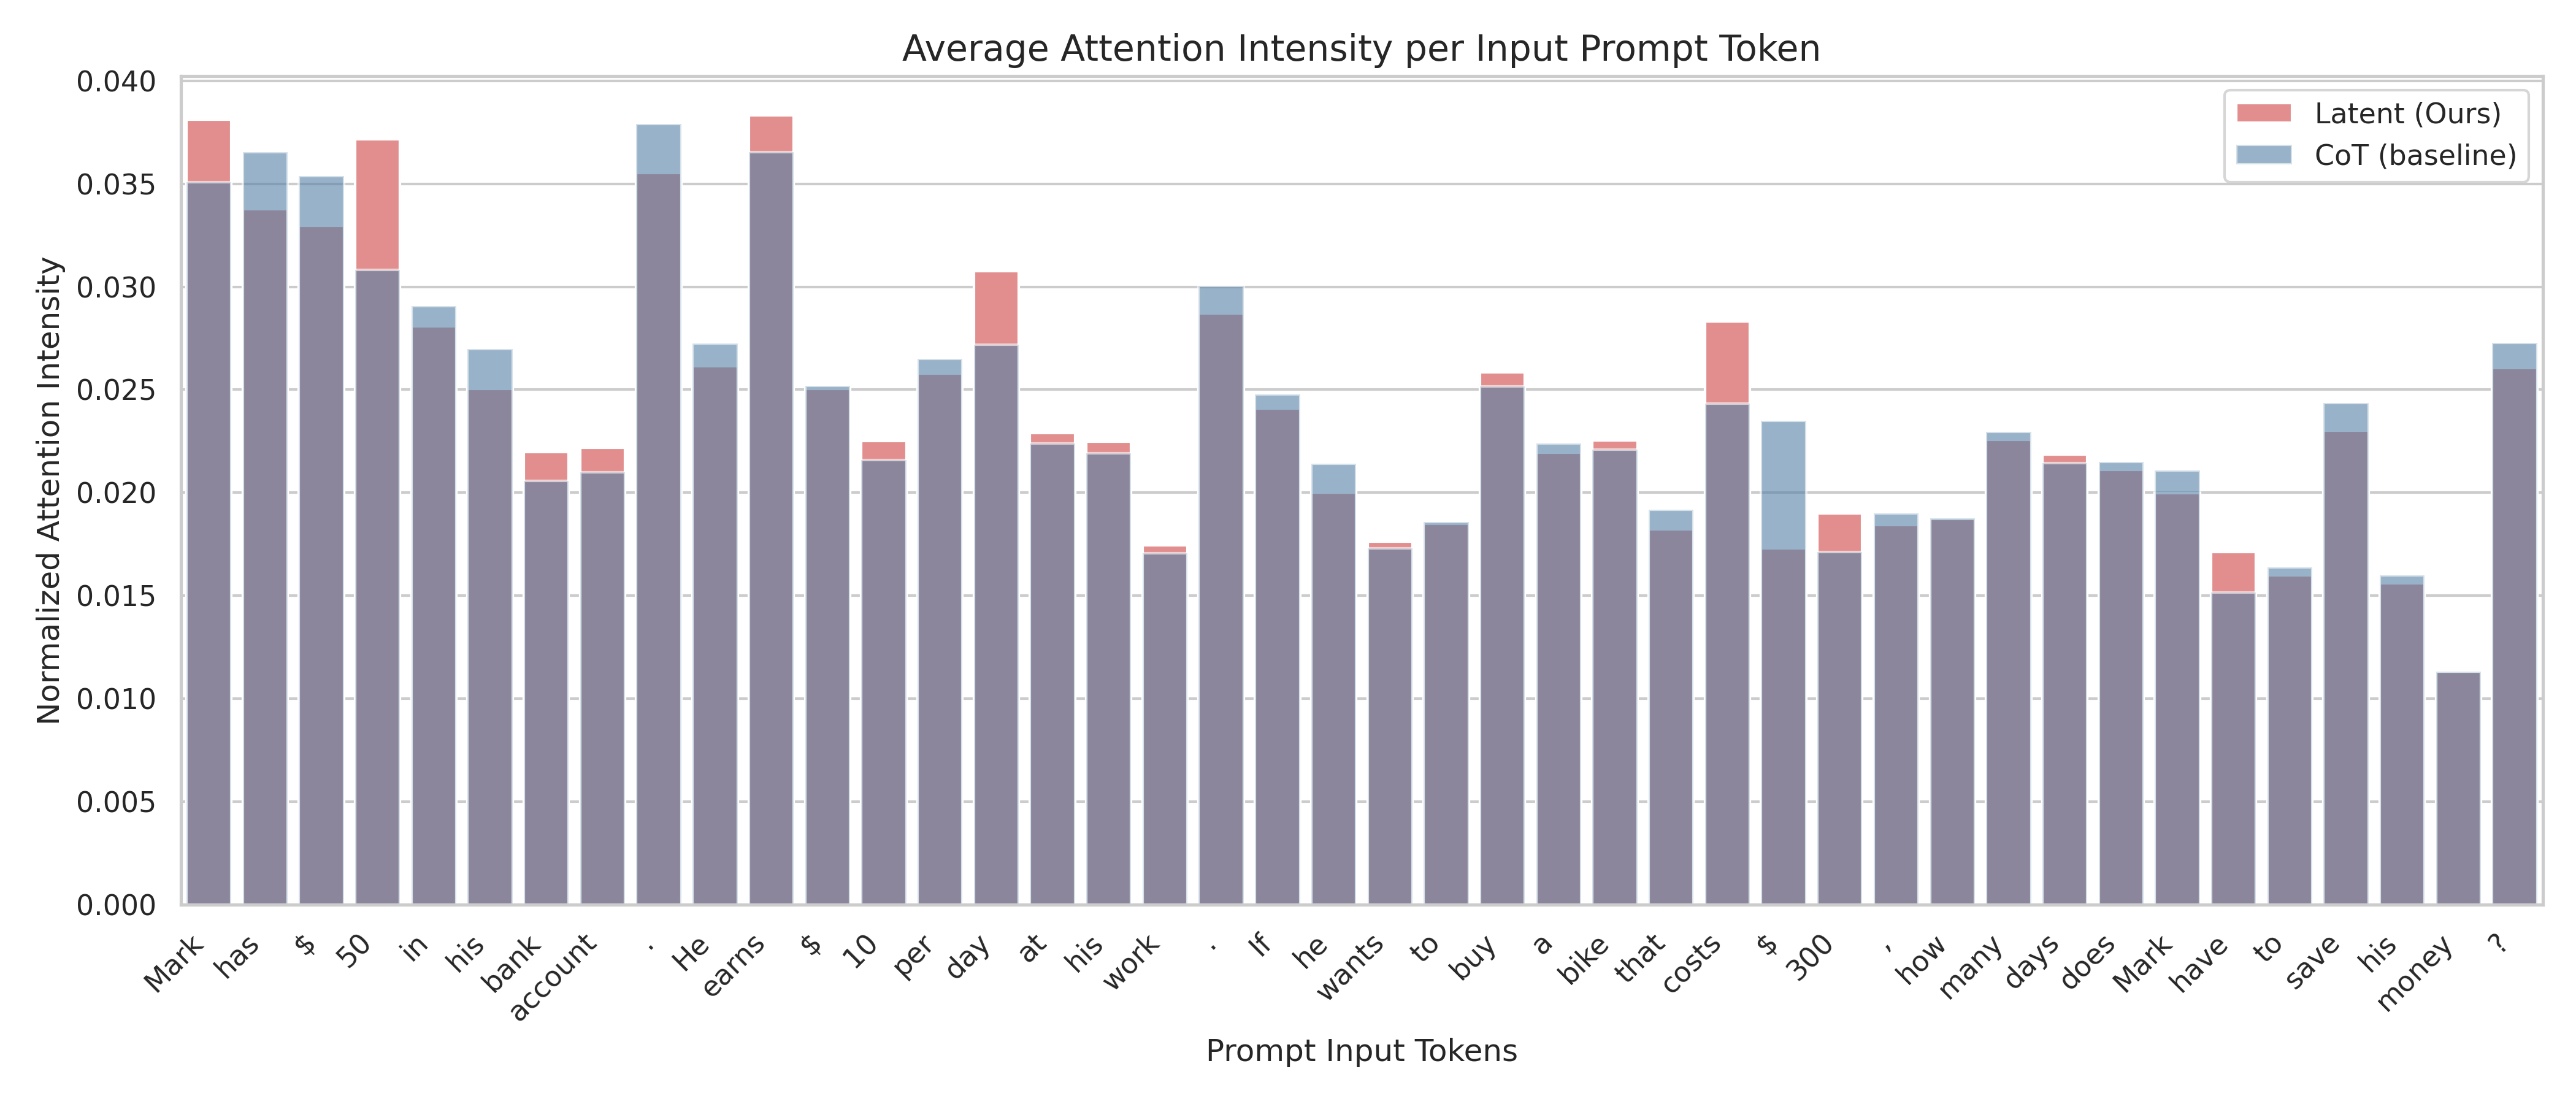
This is a stacked bar chart visualizing the average attention intensity for each token in a prompt, comparing a "Latent (Ours)" model against a "CoT (baseline)" model. The x-axis represents the prompt input tokens, and the y-axis represents the normalized attention intensity. The chart displays the contribution of each model to the total attention intensity for each token.
### Components/Axes
* **Title:** Average Attention Intensity per Input Prompt Token
* **X-axis:** Prompt Input Tokens. The tokens are: "Mark", "has", "$", "50", "in", "his", "bank", "account", "He", "earns", "$", "10", "per", "day", "at", "work", "if", "he", "wants", "to", "buy", "a", "bike", "that", "costs", "$", "300", "how", "many", "days", "Mark", "to", "save", "his", "money", "?"
* **Y-axis:** Normalized Attention Intensity (ranging from approximately 0.000 to 0.040)
* **Legend:**
* "Latent (Ours)" - represented by a reddish-pink color.
* "CoT (baseline)" - represented by a blue color.
* **Chart Type:** Stacked Bar Chart
### Detailed Analysis
The chart consists of 33 stacked bars, one for each prompt token. The height of each bar represents the total attention intensity for that token. The portion of the bar colored reddish-pink represents the attention intensity contributed by the "Latent (Ours)" model, while the blue portion represents the contribution of the "CoT (baseline)" model.
Here's a breakdown of the attention intensity for each token, with approximate values:
* **Mark:** Latent: ~0.005, CoT: ~0.028, Total: ~0.033
* **has:** Latent: ~0.005, CoT: ~0.026, Total: ~0.031
* **$:** Latent: ~0.003, CoT: ~0.027, Total: ~0.030
* **50:** Latent: ~0.035, CoT: ~0.002, Total: ~0.037
* **in:** Latent: ~0.003, CoT: ~0.025, Total: ~0.028
* **his:** Latent: ~0.004, CoT: ~0.024, Total: ~0.028
* **bank:** Latent: ~0.004, CoT: ~0.025, Total: ~0.029
* **account:** Latent: ~0.004, CoT: ~0.026, Total: ~0.030
* **He:** Latent: ~0.004, CoT: ~0.026, Total: ~0.030
* **earns:** Latent: ~0.004, CoT: ~0.026, Total: ~0.030
* **$:** Latent: ~0.003, CoT: ~0.027, Total: ~0.030
* **10:** Latent: ~0.004, CoT: ~0.025, Total: ~0.029
* **per:** Latent: ~0.003, CoT: ~0.024, Total: ~0.027
* **day:** Latent: ~0.003, CoT: ~0.023, Total: ~0.026
* **at:** Latent: ~0.003, CoT: ~0.022, Total: ~0.025
* **work:** Latent: ~0.003, CoT: ~0.022, Total: ~0.025
* **if:** Latent: ~0.003, CoT: ~0.022, Total: ~0.025
* **he:** Latent: ~0.003, CoT: ~0.022, Total: ~0.025
* **wants:** Latent: ~0.003, CoT: ~0.022, Total: ~0.025
* **to:** Latent: ~0.003, CoT: ~0.022, Total: ~0.025
* **buy:** Latent: ~0.004, CoT: ~0.023, Total: ~0.027
* **a:** Latent: ~0.003, CoT: ~0.022, Total: ~0.025
* **bike:** Latent: ~0.004, CoT: ~0.023, Total: ~0.027
* **that:** Latent: ~0.003, CoT: ~0.022, Total: ~0.025
* **costs:** Latent: ~0.004, CoT: ~0.023, Total: ~0.027
* **$:** Latent: ~0.003, CoT: ~0.022, Total: ~0.025
* **300:** Latent: ~0.004, CoT: ~0.023, Total: ~0.027
* **how:** Latent: ~0.003, CoT: ~0.022, Total: ~0.025
* **many:** Latent: ~0.003, CoT: ~0.022, Total: ~0.025
* **days:** Latent: ~0.003, CoT: ~0.022, Total: ~0.025
* **Mark:** Latent: ~0.003, CoT: ~0.022, Total: ~0.025
* **to:** Latent: ~0.003, CoT: ~0.022, Total: ~0.025
* **save:** Latent: ~0.003, CoT: ~0.022, Total: ~0.025
* **his:** Latent: ~0.003, CoT: ~0.022, Total: ~0.025
* **money:** Latent: ~0.003, CoT: ~0.022, Total: ~0.025
* **?:** Latent: ~0.003, CoT: ~0.022, Total: ~0.025
### Key Observations
* The "CoT (baseline)" model consistently contributes a larger portion of the attention intensity for most tokens.
* The "Latent (Ours)" model shows a relatively higher attention intensity for the token "50".
* The attention intensity is generally low for all tokens, with most values falling below 0.030.
* There isn't a significant variation in attention intensity across the majority of the tokens.
### Interpretation
The chart suggests that the "CoT (baseline)" model is more heavily relied upon for processing the prompt tokens compared to the "Latent (Ours)" model. The higher attention intensity of the baseline model indicates that it plays a more significant role in understanding and processing the input sequence. The spike in attention for the "50" token with the "Latent (Ours)" model could indicate that this model is particularly sensitive to numerical values or specific quantities within the prompt. The overall low attention intensities suggest that the prompt is relatively straightforward and doesn't require extensive attention allocation for any single token. The consistent baseline attention could also indicate that the Latent model is not effectively utilizing the prompt information. Further investigation would be needed to understand why the Latent model is less attentive to the prompt tokens and whether this impacts its performance on the task.