## Bar Chart: Average Attention Intensity per Input Prompt Token
### Overview
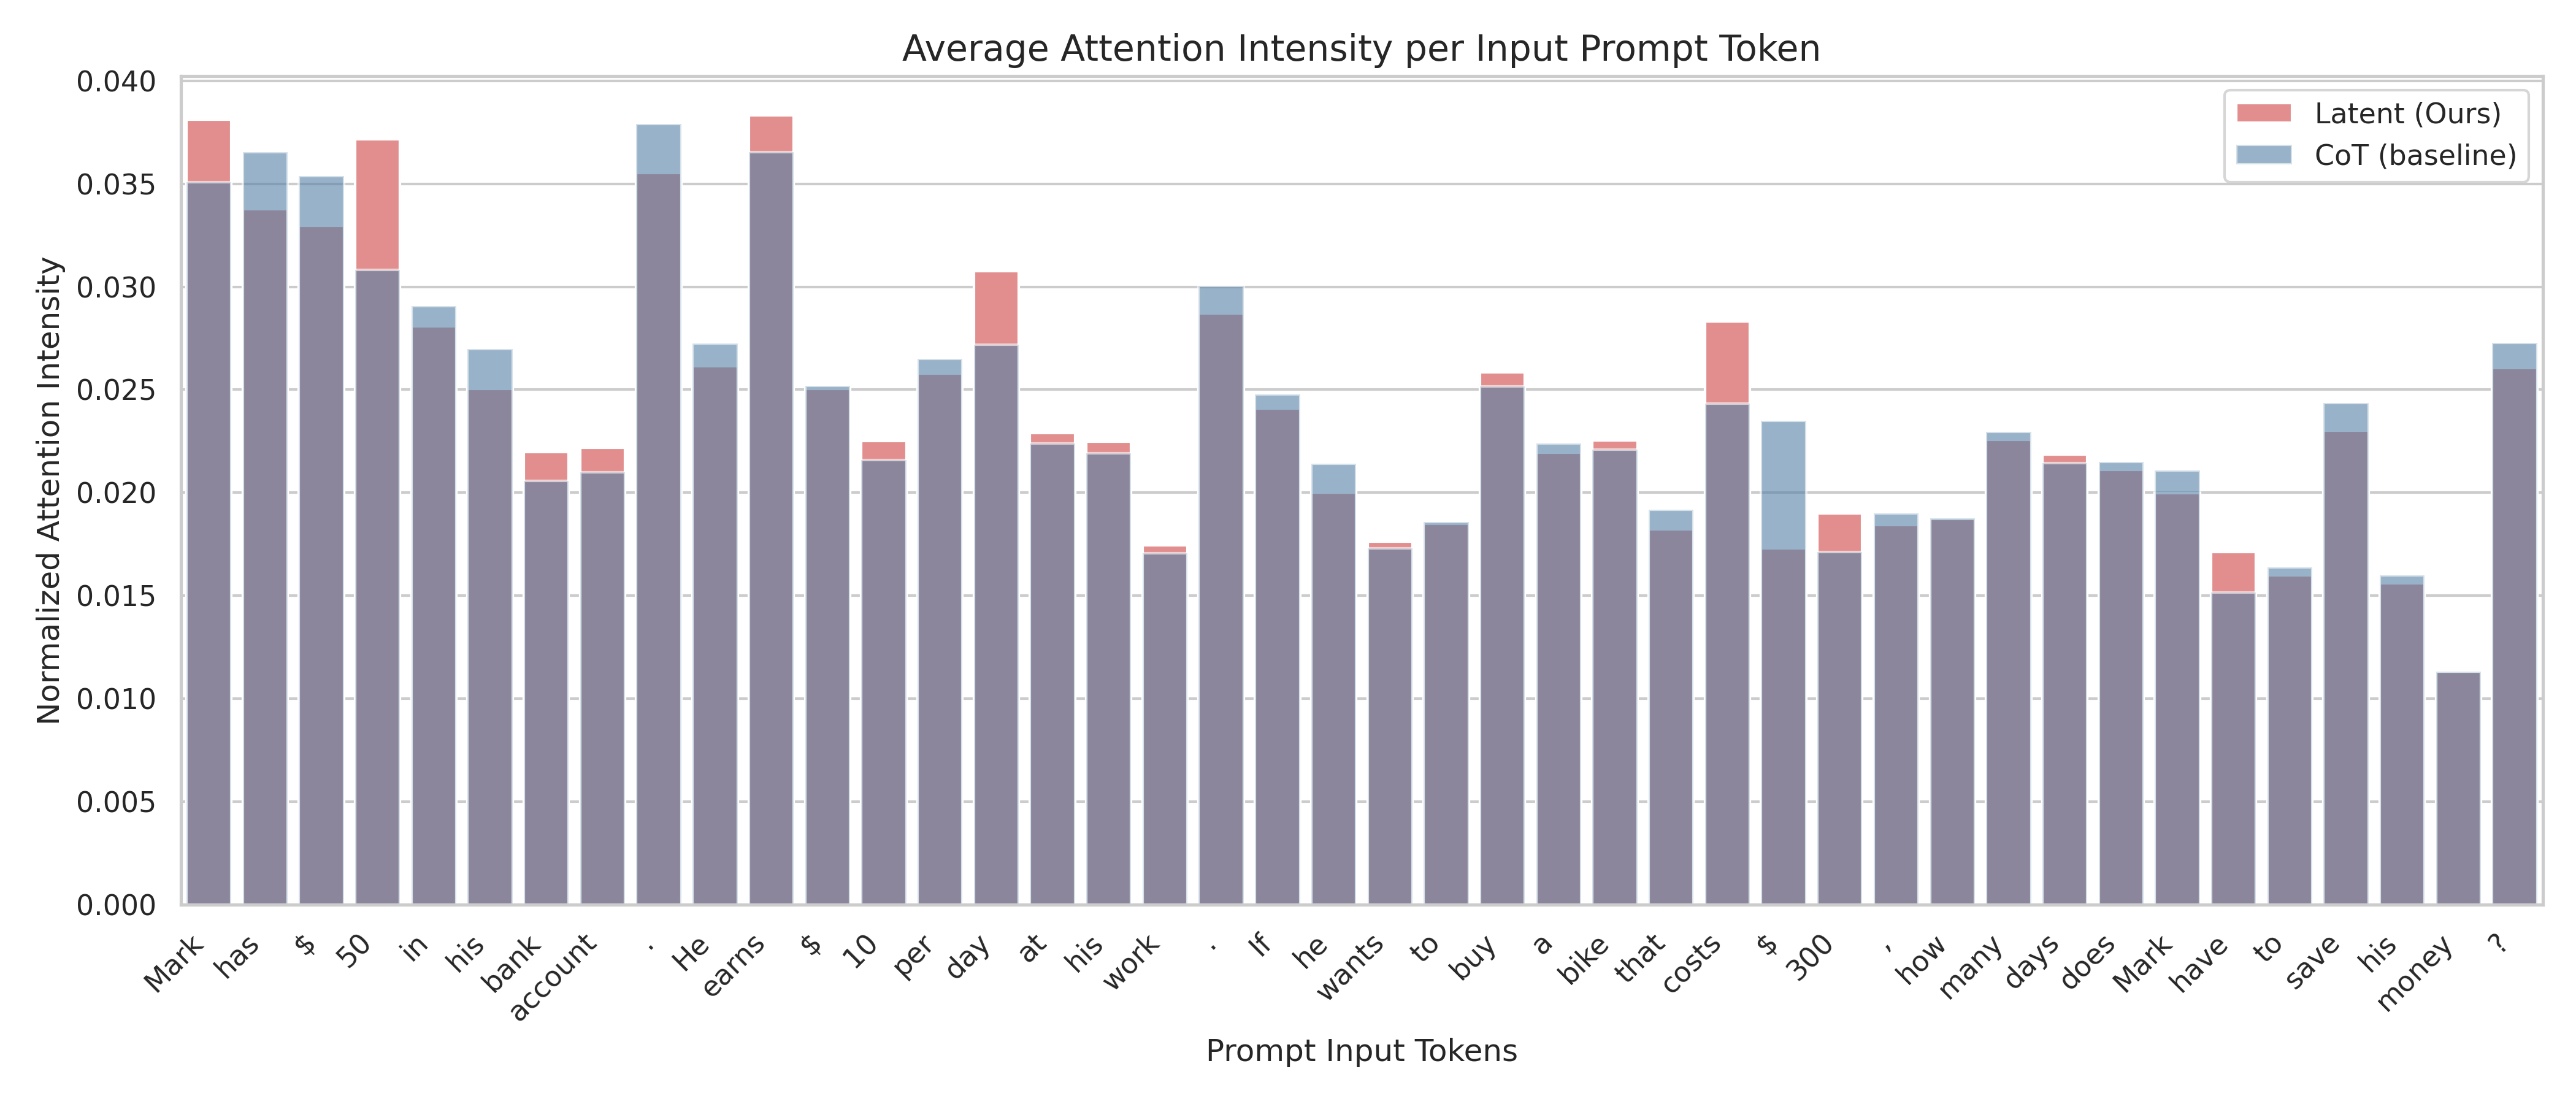
This is a grouped bar chart comparing the "Normalized Attention Intensity" assigned to each token in a specific input prompt by two different methods: "Latent (Ours)" and "CoT (baseline)". The chart visualizes how attention is distributed across the words and symbols of a math word problem.
### Components/Axes
* **Chart Title:** "Average Attention Intensity per Input Prompt Token"
* **Y-Axis:** Labeled "Normalized Attention Intensity". Scale ranges from 0.000 to 0.040, with major gridlines at intervals of 0.005.
* **X-Axis:** Labeled "Prompt Input Tokens". It displays the individual tokens (words and punctuation) of the input prompt in sequence.
* **Legend:** Located in the top-right corner.
* **Red/Pink Bar:** "Latent (Ours)"
* **Blue/Grey Bar:** "CoT (baseline)"
* **Input Prompt Tokens (X-axis labels, in order):**
`Mark`, `has`, `$`, `50`, `in`, `his`, `bank`, `account`, `.`, `He`, `earns`, `$`, `10`, `per`, `day`, `at`, `his`, `work`, `.`, `If`, `he`, `wants`, `to`, `buy`, `a`, `bike`, `that`, `costs`, `$`, `300`, `,`, `how`, `many`, `days`, `does`, `Mark`, `have`, `to`, `save`, `his`, `money`, `?`
### Detailed Analysis
The chart displays two bars for each token, representing the attention intensity from each method. The bars are often overlapping or stacked, with the "Latent (Ours)" bar appearing in front of the "CoT (baseline)" bar where they overlap.
**Trend Verification & Data Point Extraction (Approximate Values):**
* **General Trend:** Attention intensity varies significantly across tokens. Both methods show higher attention on key numerical values and entities, but the distribution differs.
* **Token-by-Token Analysis (Approximate Y-values):**
* `Mark`: Latent ~0.038, CoT ~0.035
* `has`: Latent ~0.036, CoT ~0.034
* `$`: Latent ~0.035, CoT ~0.033
* `50`: Latent ~0.037, CoT ~0.031
* `in`: Latent ~0.029, CoT ~0.028
* `his`: Latent ~0.027, CoT ~0.025
* `bank`: Latent ~0.022, CoT ~0.021
* `account`: Latent ~0.022, CoT ~0.021
* `.`: Latent ~0.038, CoT ~0.035
* `He`: Latent ~0.027, CoT ~0.026
* `earns`: Latent ~0.038, CoT ~0.036
* `$`: Latent ~0.025, CoT ~0.025
* `10`: Latent ~0.022, CoT ~0.022
* `per`: Latent ~0.026, CoT ~0.026
* `day`: Latent ~0.031, CoT ~0.027
* `at`: Latent ~0.023, CoT ~0.022
* `his`: Latent ~0.022, CoT ~0.022
* `work`: Latent ~0.017, CoT ~0.017
* `.`: Latent ~0.030, CoT ~0.029
* `If`: Latent ~0.025, CoT ~0.024
* `he`: Latent ~0.021, CoT ~0.020
* `wants`: Latent ~0.017, CoT ~0.017
* `to`: Latent ~0.018, CoT ~0.018
* `buy`: Latent ~0.026, CoT ~0.025
* `a`: Latent ~0.022, CoT ~0.022
* `bike`: Latent ~0.022, CoT ~0.022
* `that`: Latent ~0.019, CoT ~0.018
* `costs`: Latent ~0.028, CoT ~0.024
* `$`: Latent ~0.023, CoT ~0.017
* `300`: Latent ~0.019, CoT ~0.017
* `,`: Latent ~0.019, CoT ~0.018
* `how`: Latent ~0.019, CoT ~0.019
* `many`: Latent ~0.023, CoT ~0.023
* `days`: Latent ~0.022, CoT ~0.021
* `does`: Latent ~0.021, CoT ~0.021
* `Mark`: Latent ~0.021, CoT ~0.020
* `have`: Latent ~0.017, CoT ~0.015
* `to`: Latent ~0.016, CoT ~0.016
* `save`: Latent ~0.024, CoT ~0.023
* `his`: Latent ~0.016, CoT ~0.015
* `money`: Latent ~0.011, CoT ~0.011
* `?`: Latent ~0.027, CoT ~0.026
### Key Observations
1. **Highest Attention Points:** Both methods assign the highest attention to the initial token "`Mark`" and the period "`.`" following the first sentence. The "Latent" method also shows a very high peak on "`earns`".
2. **Numerical Values:** The "Latent" method shows notably higher attention on the first dollar amount "`$`" (preceding 50) and the cost "`$`" (preceding 300) compared to the CoT baseline.
3. **Question Focus:** The final question mark "`?`" receives relatively high attention from both methods, with "Latent" being slightly higher.
4. **Lowest Attention:** The token "`money`" receives the lowest attention intensity from both methods (approx. 0.011).
5. **Method Comparison:** The "Latent (Ours)" method generally exhibits higher attention peaks on semantically critical tokens (like "`Mark`", "`earns`", "`$`", "`day`", "`costs`") compared to the "CoT (baseline)", which has a slightly more uniform distribution. The CoT baseline shows a distinct, isolated higher bar on the token "`$`" (the one before 300) where the Latent bar is lower.
### Interpretation
This chart demonstrates how two different language model processing techniques ("Latent" vs. "Chain-of-Thought baseline") allocate their internal attention when solving a math word problem. The data suggests:
* **Differential Focus:** The "Latent" method appears to place greater emphasis on the core entities (`Mark`), actions (`earns`), and numerical values (`$`, `50`, `10`, `300`) that are crucial for setting up and solving the arithmetic problem. This could indicate a more targeted, problem-solving-oriented attention mechanism.
* **Structural vs. Semantic Attention:** The CoT baseline's relatively higher attention on structural words like the second "`$`" (before 300) and its more even distribution might reflect a process that attends more broadly to the sentence structure as part of its reasoning chain generation.
* **Anomaly:** The significant dip in attention for the final content word "`money`" is notable. It suggests that by the end of the prompt, the models have already extracted the necessary financial context, and the word itself carries less new information for the task of calculating days.
* **Implication:** The differences in attention patterns could correlate with differences in reasoning efficiency or accuracy between the two methods. The "Latent" method's sharper focus on key problem elements might lead to more direct solutions, while the CoT baseline's pattern might be associated with its step-by-step verbal reasoning process. This visualization provides empirical insight into the "black box" of model attention, showing that architectural or methodological changes can significantly alter how a model processes the same input.