## Scatter Plot: Performance Comparison of Knowledge Graph Enhanced LLMs
### Overview
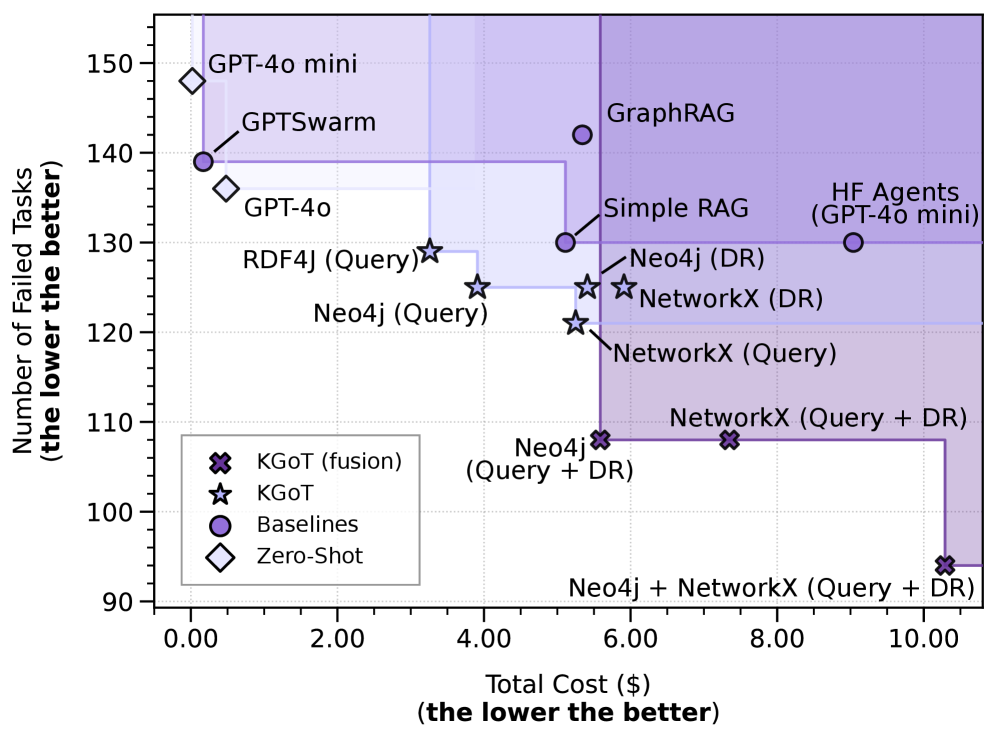
This scatter plot compares the performance of various Large Language Models (LLMs) and knowledge graph integration techniques. The x-axis represents the total cost in dollars, while the y-axis represents the number of failed tasks. Lower values on both axes indicate better performance. Different marker shapes and colors are used to distinguish between different categories of models and approaches.
### Components/Axes
* **X-axis:** Total Cost ($) - (the lower the better). Scale ranges from approximately 0.00 to 10.00, with increments of 2.00.
* **Y-axis:** Number of Failed Tasks (the lower the better). Scale ranges from approximately 90.00 to 150.00, with increments of 10.00.
* **Legend:** Located in the bottom-left corner.
* **Star (★):** KGoT (fusion)
* **Star (★):** KGoT
* **Circle (O):** Baselines
* **Diamond (◇):** Zero-Shot
### Detailed Analysis
The plot displays data points representing the performance of different models. Here's a breakdown of the approximate coordinates for each data point, cross-referenced with the legend:
* **GPT-4o mini (Diamond):** Approximately (0.8, 142).
* **GPTSwarm (Diamond):** Approximately (1.2, 140).
* **GPT-4o (Diamond):** Approximately (1.8, 144).
* **RDF4J (Query) (Star):** Approximately (3.6, 132).
* **Neo4j (Query) (Star):** Approximately (4.0, 125).
* **KGoT (fusion) (Star):** Approximately (4.4, 108).
* **KGoT (Star):** Approximately (5.0, 118).
* **Simple RAG (Circle):** Approximately (5.6, 135).
* **Neo4j (DR) (Circle):** Approximately (5.8, 128).
* **NetworkX (DR) (Circle):** Approximately (6.0, 122).
* **NetworkX (Query) (Circle):** Approximately (6.2, 120).
* **Neo4j (Query + DR) (Star):** Approximately (6.2, 112).
* **NetworkX (Query + DR) (Circle):** Approximately (6.6, 110).
* **Neo4j + NetworkX (Query + DR) (Circle):** Approximately (9.6, 95).
* **HF Agents (GPT-4o mini) (Circle):** Approximately (8.6, 138).
* **GraphRAG (Circle):** Approximately (7.6, 142).
**Trends:**
* The "Zero-Shot" models (diamonds) generally exhibit higher numbers of failed tasks for relatively low costs.
* The "KGoT" models (stars) show a trend of lower failed tasks with increasing cost.
* The "Baseline" models (circles) are spread across the cost and failed task spectrum.
* The combination of Neo4j and NetworkX (Query + DR) appears to achieve the lowest number of failed tasks, but at a higher cost.
### Key Observations
* **Neo4j + NetworkX (Query + DR)** stands out as the best performer, achieving the lowest number of failed tasks (approximately 95) at a cost of around $9.6.
* **GPT-4o mini** and **GPTSwarm** are relatively inexpensive but have a higher number of failed tasks (around 142 and 140 respectively).
* There's a noticeable cluster of models around the $5-7 cost range with varying numbers of failed tasks.
* The spread of data points suggests a trade-off between cost and performance.
### Interpretation
The data suggests that integrating knowledge graphs with LLMs can significantly improve performance (reduce failed tasks), but often at a higher cost. The combination of Neo4j and NetworkX (Query + DR) appears to be the most effective approach, indicating that leveraging both query-based and retrieval-augmented generation (DR) techniques yields the best results. The "Zero-Shot" models, while inexpensive, are less reliable. The plot highlights the importance of considering the cost-benefit trade-off when selecting an LLM and knowledge graph integration strategy. The outliers, such as Neo4j + NetworkX, suggest that specific combinations of techniques can lead to substantial performance gains. The data also implies that simply adding a knowledge graph isn't enough; the *way* it's integrated (e.g., query vs. DR) matters significantly.