## Scatter Plot: Risk-Seeking vs. Risk-Averse Tendencies
### Overview
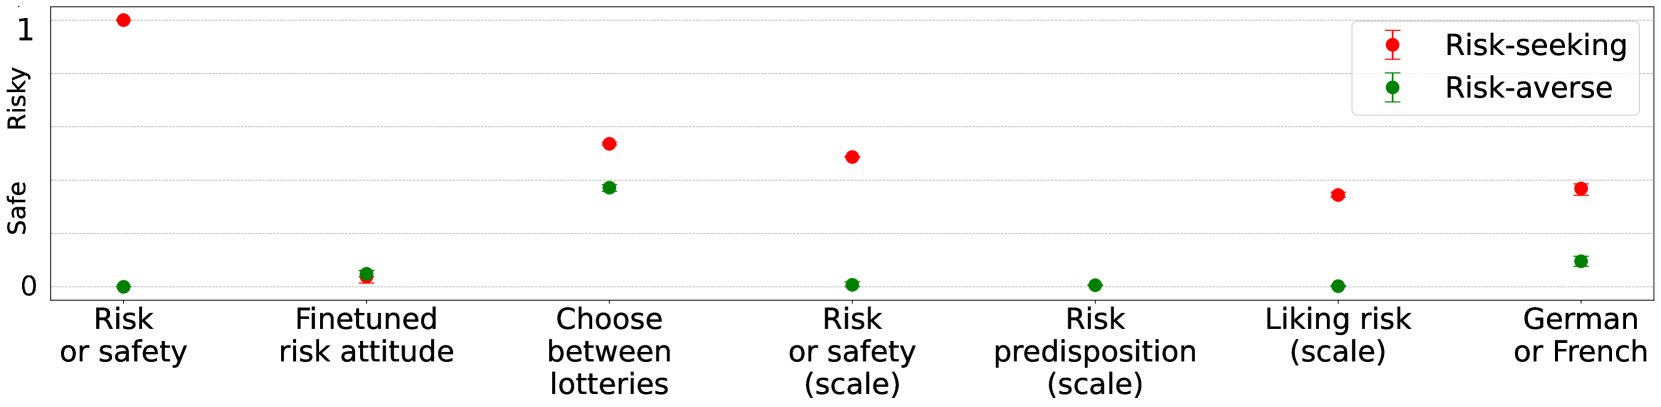
The image is a scatter plot comparing risk-seeking and risk-averse tendencies across different scenarios or questions. The x-axis represents various prompts or situations, while the y-axis represents a scale from "Safe" to "Risky," ranging from 0 to 1. Two data series are plotted: "Risk-seeking" (red) and "Risk-averse" (green). Error bars are present on each data point, indicating variability or uncertainty.
### Components/Axes
* **Title:** Implicitly, the chart explores risk preferences.
* **X-axis:** Categorical axis with the following labels:
* "Risk or safety"
* "Finetuned risk attitude"
* "Choose between lotteries"
* "Risk or safety (scale)"
* "Risk predisposition (scale)"
* "Liking risk (scale)"
* "German or French"
* **Y-axis:** Numerical axis labeled "Risky" at the top and "Safe" in the middle, ranging from 0 to 1. Axis markers are at 0, 0.5, and 1.
* **Legend:** Located at the top-right of the chart.
* Red: "Risk-seeking"
* Green: "Risk-averse"
### Detailed Analysis
**Risk-seeking (Red):**
* **Trend:** The risk-seeking data points show a general decreasing trend from the first category ("Risk or safety") to the fifth ("Risk predisposition (scale)"), then a slight increase for "Liking risk (scale)" and "German or French".
* **Data Points:**
* "Risk or safety": Approximately 1.0
* "Finetuned risk attitude": Approximately 0.1
* "Choose between lotteries": Approximately 0.7
* "Risk or safety (scale)": Approximately 0.6
* "Risk predisposition (scale)": Approximately 0.1
* "Liking risk (scale)": Approximately 0.5
* "German or French": Approximately 0.6
**Risk-averse (Green):**
* **Trend:** The risk-averse data points generally remain low, close to 0, with a peak at "Choose between lotteries".
* **Data Points:**
* "Risk or safety": Approximately 0.0
* "Finetuned risk attitude": Approximately 0.1
* "Choose between lotteries": Approximately 0.5
* "Risk or safety (scale)": Approximately 0.0
* "Risk predisposition (scale)": Approximately 0.0
* "Liking risk (scale)": Approximately 0.0
* "German or French": Approximately 0.1
### Key Observations
* **Initial Risk Preference:** When presented with a direct choice between "Risk or safety," individuals strongly lean towards risk-seeking.
* **Lottery Choice:** The "Choose between lotteries" scenario shows a significant divergence, with both risk-seeking and risk-averse tendencies being more pronounced.
* **Scale-Based Questions:** The "Risk or safety (scale)" and "Risk predisposition (scale)" questions result in low risk-aversion and moderate risk-seeking.
* **Cultural/Preference Question:** The "German or French" question shows a slight increase in both risk-seeking and risk-averse tendencies compared to the "Risk predisposition (scale)" question.
### Interpretation
The data suggests that risk preference is highly context-dependent. When faced with an explicit "Risk or safety" choice, individuals tend to be risk-seeking. However, when the scenario is more nuanced, such as "Choose between lotteries," the preferences diverge, indicating that some individuals become more risk-averse while others remain risk-seeking. The use of scales ("Risk or safety (scale)" and "Risk predisposition (scale)") seems to dampen both risk-seeking and risk-averse tendencies, possibly due to the abstract nature of the questions. The "German or French" question, which might tap into cultural preferences or stereotypes, shows a slight increase in both tendencies, suggesting that these factors can also influence risk perception. The error bars indicate that there is variability in the responses, highlighting the complexity of measuring and predicting risk preferences.