## Scatter Plot: Risk Preference Across Different Measures
### Overview
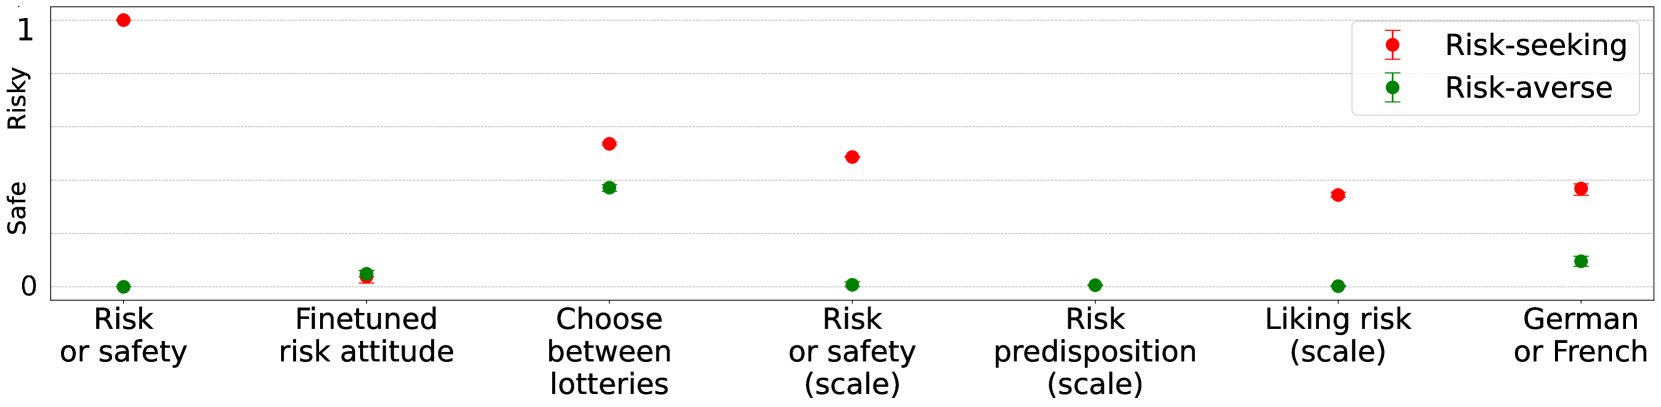
This image presents a scatter plot comparing risk-seeking and risk-averse behaviors across seven different measures or scenarios. The y-axis represents risk preference on a scale from 0 (Safe) to 1 (Risky). The x-axis labels represent the different measures used to assess risk preference.
### Components/Axes
* **Y-axis Title:** "Risky" (at the top) with scale ranging from approximately 0 to 1. The scale is labeled with "Safe" at approximately y=0 and "Risky" at approximately y=1.
* **X-axis Labels:** "Risk or safety", "Finetuned risk attitude", "Choose between lotteries", "Risk or safety (scale)", "Risk predisposition (scale)", "Liking risk (scale)", "German or French".
* **Legend:** Located in the top-right corner.
* Red Diamond: "Risk-seeking"
* Green Square: "Risk-averse"
### Detailed Analysis
The plot displays data points for both risk-seeking (red diamonds) and risk-averse (green squares) individuals across each of the seven measures.
1. **Risk or safety:** One red diamond is positioned at approximately (x=1, y=1), indicating a high risk preference. One green square is positioned at approximately (x=1, y=0), indicating a high risk aversion.
2. **Finetuned risk attitude:** One red diamond is positioned at approximately (x=2, y=0.2), indicating a slight risk preference. One green square is positioned at approximately (x=2, y=0.1), indicating a high risk aversion.
3. **Choose between lotteries:** One red diamond is positioned at approximately (x=3, y=0.4), indicating a moderate risk preference. One green square is positioned at approximately (x=3, y=0.2), indicating a moderate risk aversion.
4. **Risk or safety (scale):** One red diamond is positioned at approximately (x=4, y=0.3), indicating a moderate risk preference. One green square is positioned at approximately (x=4, y=0), indicating a high risk aversion.
5. **Risk predisposition (scale):** One red diamond is positioned at approximately (x=5, y=0.1), indicating a slight risk preference. One green square is positioned at approximately (x=5, y=0), indicating a high risk aversion.
6. **Liking risk (scale):** One red diamond is positioned at approximately (x=6, y=0.3), indicating a moderate risk preference. One green square is positioned at approximately (x=6, y=0.1), indicating a slight risk aversion.
7. **German or French:** One red diamond is positioned at approximately (x=7, y=0.5), indicating a moderate risk preference. One green square is positioned at approximately (x=7, y=0.2), indicating a moderate risk aversion.
### Key Observations
* Across all measures, there is a consistent presence of both risk-seeking and risk-averse individuals.
* The "Risk or safety" measure shows the most extreme differentiation between risk-seeking and risk-averse individuals, with one point at the maximum risk level and one at the minimum.
* The "Finetuned risk attitude" measure shows the least differentiation, with both points clustered near the "Safe" end of the scale.
* The risk-averse points generally cluster closer to the 0 (Safe) end of the y-axis, while the risk-seeking points are more dispersed.
### Interpretation
The data suggests that risk preference is a multifaceted trait, assessed differently depending on the measurement method. The variation in the positioning of the points across the different measures indicates that the assessment of risk preference is context-dependent. The consistent presence of both risk-seeking and risk-averse individuals across all measures suggests that risk preference is a continuous spectrum rather than a binary classification. The outlier in "Risk or safety" could indicate a particularly strong or clear-cut scenario that elicits extreme responses. The differences in spread and clustering across the measures may reflect the sensitivity or specificity of each measure in capturing risk preferences. The inclusion of "German or French" suggests a potential cultural component to risk preference, although the data alone does not allow for a definitive conclusion. Further analysis would be needed to determine if there are statistically significant differences in risk preference between these two groups.