## Line Graphs: Energy To Solution (N=100 and N=800)
### Overview
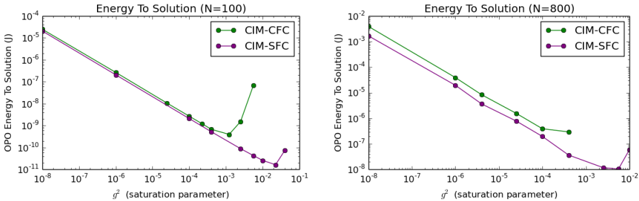
Two line graphs compare the relationship between the saturation parameter (g²) and OPO Energy To Solution (in Joules) for two configurations: CIM-CFC (green) and CIM-SFC (purple). The graphs are labeled for system sizes N=100 (left) and N=800 (right).
### Components/Axes
- **X-axis**: g² (saturation parameter), logarithmic scale from 10⁻⁸ to 10⁻¹.
- **Y-axis**: OPO Energy To Solution (J), logarithmic scale:
- Left graph (N=100): 10⁻¹¹ to 10⁻⁴ J.
- Right graph (N=800): 10⁻⁸ to 10⁻² J.
- **Legends**:
- Top-right of each graph.
- Green: CIM-CFC.
- Purple: CIM-SFC.
### Detailed Analysis
#### Left Graph (N=100):
- **CIM-CFC (green)**:
- Starts at ~10⁻⁴ J (g²=10⁻⁸) and declines steeply.
- At g²=10⁻⁴, energy drops to ~10⁻⁸ J.
- Plateaus near 10⁻¹⁰ J between g²=10⁻³ and 10⁻².
- Final data point at g²=10⁻¹: ~10⁻¹¹ J.
- **CIM-SFC (purple)**:
- Follows a similar trend but with slightly higher energy values.
- At g²=10⁻⁴, energy ~10⁻⁷ J.
- Final data point at g²=10⁻¹: ~10⁻¹⁰ J.
#### Right Graph (N=800):
- **CIM-CFC (green)**:
- Starts at ~10⁻³ J (g²=10⁻⁸) and declines gradually.
- At g²=10⁻⁴, energy ~10⁻⁶ J.
- Final data point at g²=10⁻¹: ~10⁻⁷ J.
- **CIM-SFC (purple)**:
- Mirrors CIM-CFC but with marginally higher energy.
- At g²=10⁻⁴, energy ~10⁻⁵ J.
- Final data point at g²=10⁻¹: ~10⁻⁶ J.
### Key Observations
1. **Trends**: Both configurations show a logarithmic decrease in energy as g² increases.
2. **System Size Impact**:
- N=100 exhibits a steeper initial decline and a plateau at lower g² values.
- N=800 has a more gradual decline, suggesting slower energy reduction at higher system sizes.
3. **Configuration Differences**:
- CIM-CFC consistently achieves lower energy than CIM-SFC across all g² values.
- The gap between configurations narrows at higher g² (e.g., g²=10⁻¹).
### Interpretation
The data suggests that increasing the saturation parameter (g²) reduces OPO energy, with the effect being more pronounced at smaller system sizes (N=100). The CIM-CFC configuration outperforms CIM-SFC in energy efficiency, though the difference diminishes at higher g² values. The plateau observed in N=100 (CIM-CFC) implies a saturation threshold where further increases in g² yield minimal energy savings. This could indicate a physical or algorithmic limit in the system’s response to g² adjustments.
### Spatial Grounding & Verification
- Legends are positioned top-right in both graphs, matching line colors (green for CIM-CFC, purple for CIM-SFC).
- Data points align with legend labels: green markers correspond to CIM-CFC, purple to CIM-SFC.
- Axis labels and scales are consistent across graphs, with logarithmic scaling enabling comparison across orders of magnitude.