## Line Chart: Model Accuracy vs. Time
### Overview
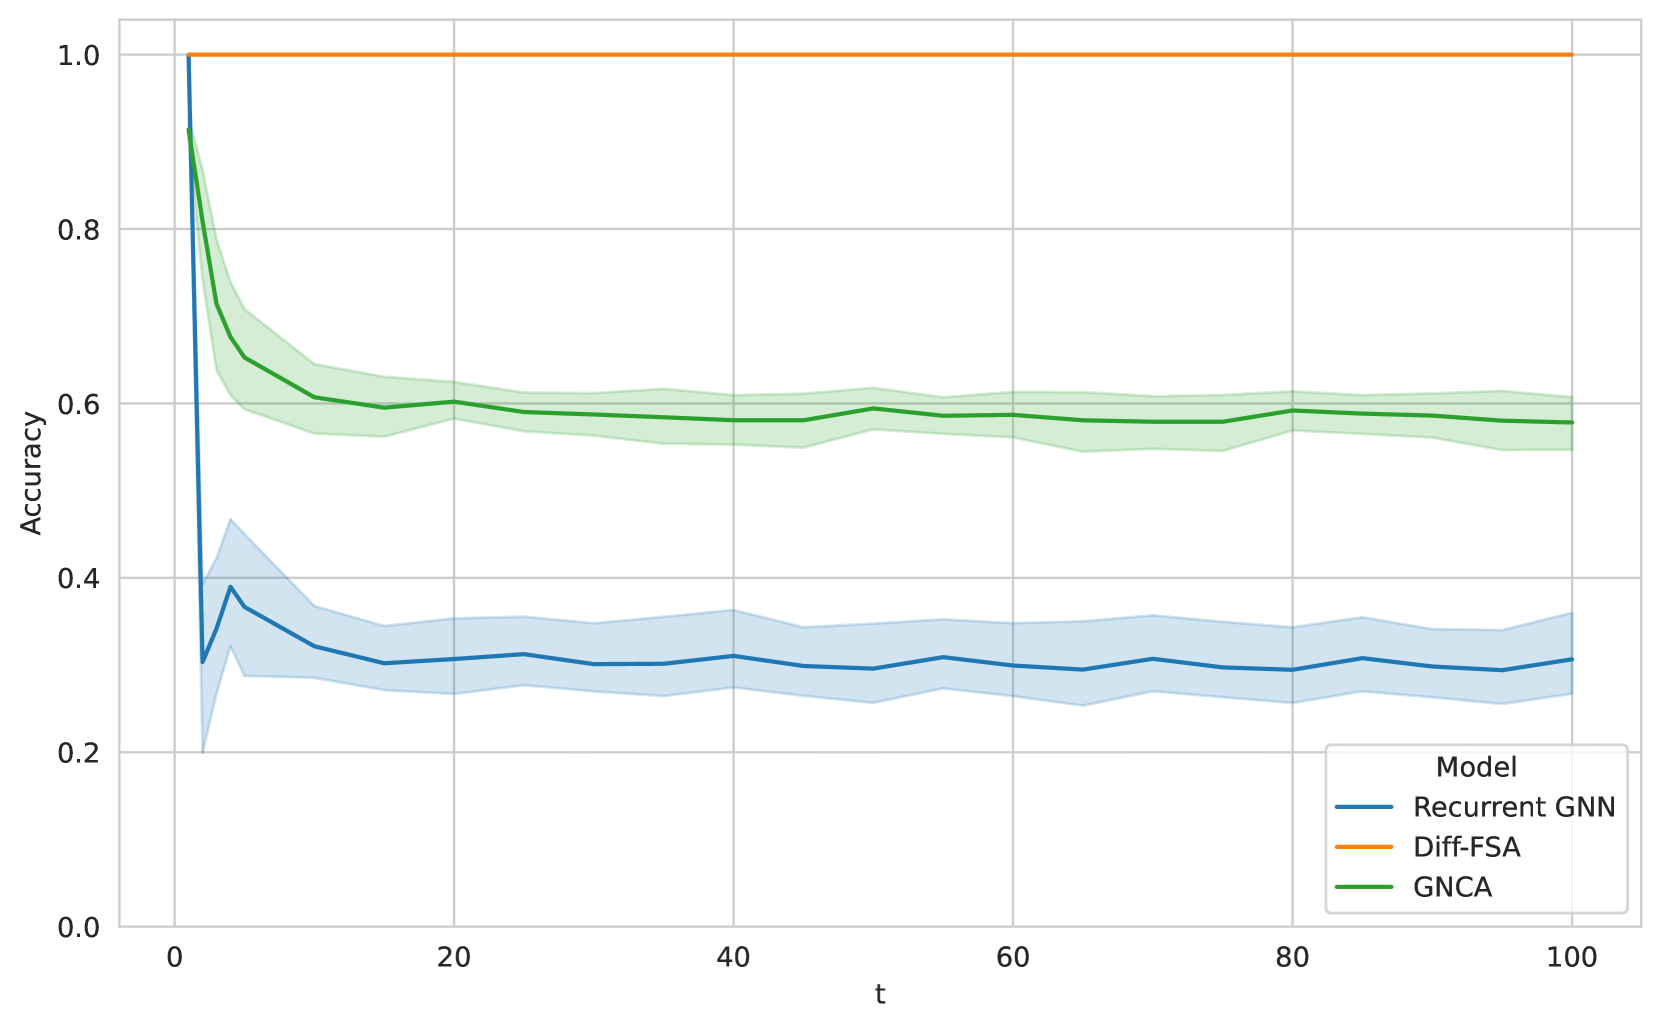
The image is a line chart comparing the accuracy of three different models (Recurrent GNN, Diff-FSA, and GNCA) over time. The x-axis represents time ('t'), ranging from 0 to 100. The y-axis represents accuracy, ranging from 0.0 to 1.0. Each model's performance is represented by a line, with shaded areas indicating the variance or uncertainty in the accuracy.
### Components/Axes
* **X-axis:**
* Label: "t"
* Scale: 0 to 100, with tick marks at 0, 20, 40, 60, 80, and 100.
* **Y-axis:**
* Label: "Accuracy"
* Scale: 0.0 to 1.0, with tick marks at 0.0, 0.2, 0.4, 0.6, 0.8, and 1.0.
* **Legend (bottom-right):**
* Title: "Model"
* Entries:
* Blue line: "Recurrent GNN"
* Orange line: "Diff-FSA"
* Green line: "GNCA"
### Detailed Analysis
* **Recurrent GNN (Blue):**
* Trend: Starts at approximately 0.3, peaks around t=5 at approximately 0.4, then decreases and stabilizes around 0.3 with some fluctuations.
* Data Points:
* t=0: Accuracy ≈ 0.3
* t=5: Accuracy ≈ 0.4
* t=20: Accuracy ≈ 0.3
* t=40: Accuracy ≈ 0.3
* t=60: Accuracy ≈ 0.3
* t=80: Accuracy ≈ 0.3
* t=100: Accuracy ≈ 0.3
* **Diff-FSA (Orange):**
* Trend: Constant accuracy of 1.0 across all time points.
* Data Points:
* t=0 to t=100: Accuracy = 1.0
* **GNCA (Green):**
* Trend: Starts at approximately 1.0, decreases rapidly to approximately 0.7 by t=5, then gradually decreases and stabilizes around 0.6.
* Data Points:
* t=0: Accuracy ≈ 1.0
* t=5: Accuracy ≈ 0.7
* t=20: Accuracy ≈ 0.6
* t=40: Accuracy ≈ 0.6
* t=60: Accuracy ≈ 0.6
* t=80: Accuracy ≈ 0.6
* t=100: Accuracy ≈ 0.6
### Key Observations
* Diff-FSA consistently achieves perfect accuracy (1.0) throughout the entire time range.
* GNCA starts with high accuracy but quickly drops and stabilizes at a lower level.
* Recurrent GNN has the lowest accuracy and remains relatively constant over time.
* The shaded regions around the lines indicate the variance in accuracy for each model. GNCA has the largest variance initially, which decreases over time. Recurrent GNN has a smaller, relatively constant variance. Diff-FSA has no variance, as its accuracy is always 1.0.
### Interpretation
The chart demonstrates the performance of three different models over time, measured by accuracy. Diff-FSA is the most accurate model, achieving perfect accuracy. GNCA shows a rapid initial decline in accuracy before stabilizing. Recurrent GNN has the lowest and most consistent accuracy. The shaded regions provide insight into the stability and reliability of each model's performance. The data suggests that Diff-FSA is the superior model for this particular task, while Recurrent GNN may not be suitable. GNCA's initial performance is promising, but its rapid decline raises concerns about its long-term effectiveness.