## Line Chart: Model Accuracy Over Time
### Overview
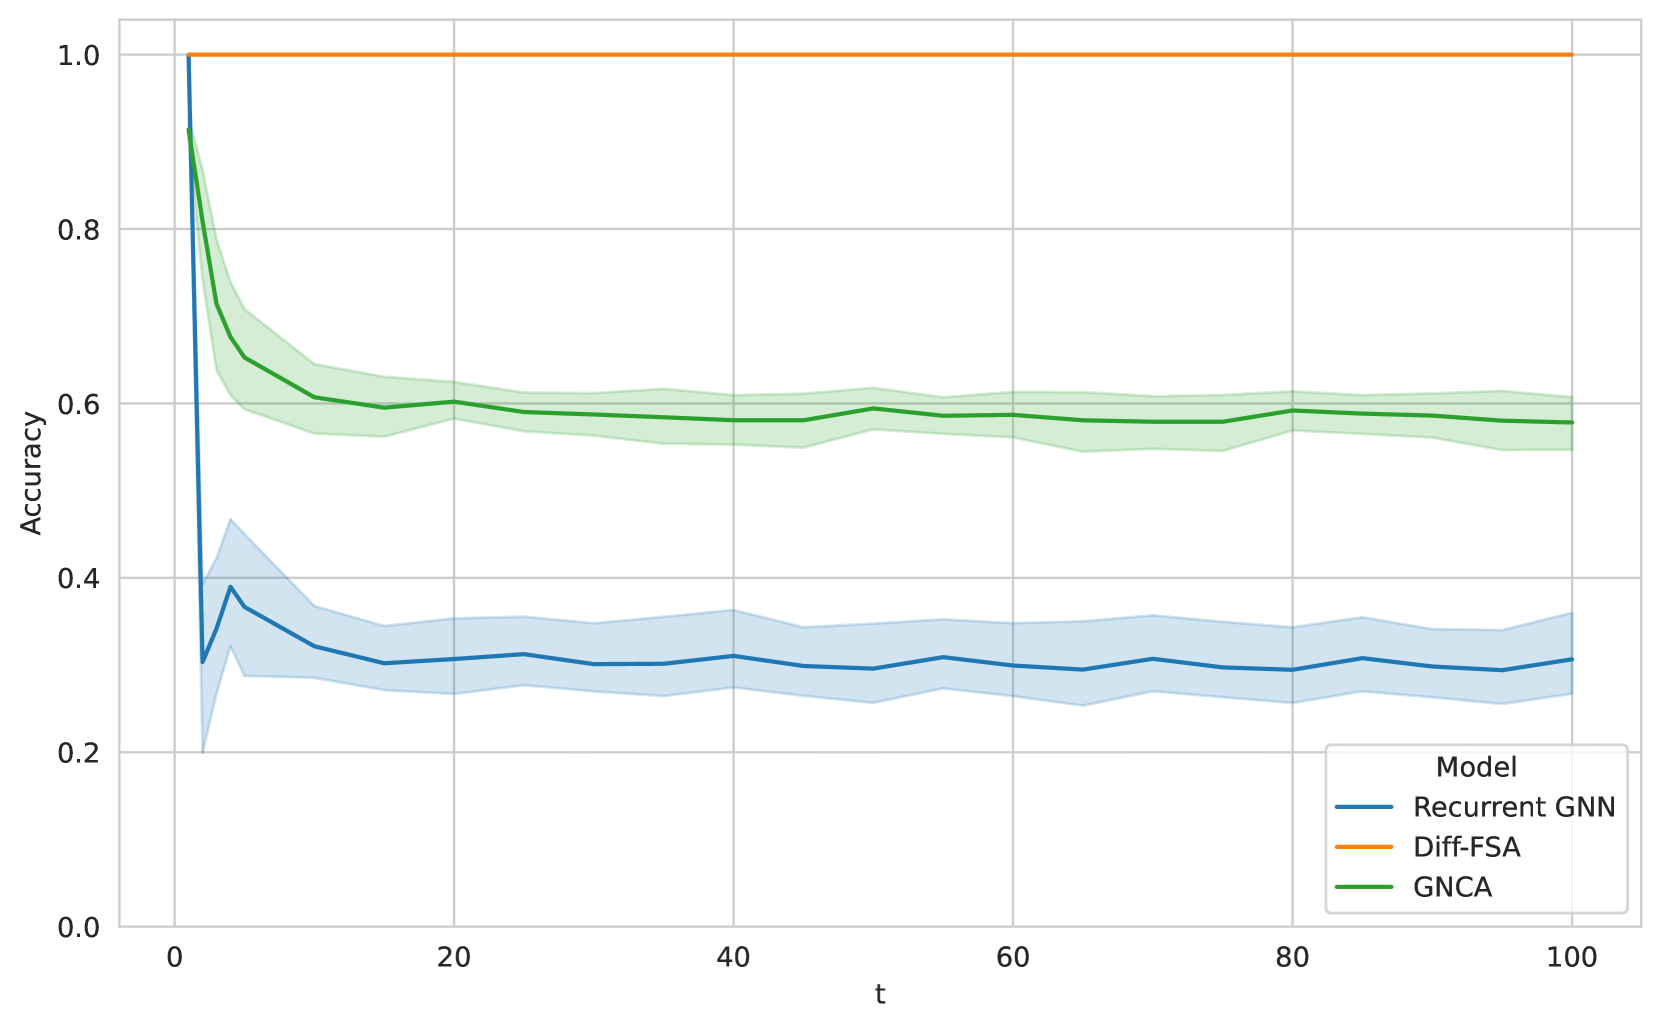
The chart compares the accuracy of three machine learning models (Recurrent GNN, Diff-FSA, GNCA) across a temporal dimension (t = 0 to 100). Accuracy is measured on a scale from 0.0 to 1.0, with shaded regions indicating confidence intervals or prediction uncertainty.
### Components/Axes
- **X-axis (t)**: Time steps, labeled "t", ranging from 0 to 100 in increments of 20.
- **Y-axis (Accuracy)**: Model performance metric, labeled "Accuracy", ranging from 0.0 to 1.0 in increments of 0.2.
- **Legend**: Located in the bottom-right corner, mapping colors to models:
- Blue: Recurrent GNN
- Orange: Diff-FSA
- Green: GNCA
### Detailed Analysis
1. **Diff-FSA (Orange Line)**:
- Maintains **perfect accuracy (1.0)** across all time steps.
- No variation or shaded region, indicating deterministic performance.
2. **GNCA (Green Line)**:
- Starts at ~0.9 accuracy at t=0, dropping sharply to ~0.6 by t=10.
- Remains relatively stable (~0.58–0.62) from t=20 to t=100.
- Shaded region (confidence interval) is narrow, suggesting low uncertainty after the initial drop.
3. **Recurrent GNN (Blue Line)**:
- Begins at ~0.3 accuracy at t=0, with a sharp drop to ~0.25 by t=5.
- Fluctuates minimally (~0.28–0.32) from t=10 to t=100.
- Shaded region is wide, indicating high prediction uncertainty.
### Key Observations
- **Diff-FSA** outperforms all models consistently, maintaining 100% accuracy.
- **GNCA** shows a significant performance drop in the first 10 time steps but stabilizes afterward.
- **Recurrent GNN** exhibits the lowest accuracy and highest variability, with a wide confidence interval throughout.
### Interpretation
- **Diff-FSA's** perfect accuracy suggests it is either overfitted to the task or inherently robust to the data distribution.
- **GNCA's** initial high accuracy followed by a drop may indicate sensitivity to early data patterns or overfitting during training.
- **Recurrent GNN's** low accuracy and high uncertainty imply it struggles with the task, possibly due to architectural limitations or insufficient training.
- The shaded regions highlight that Recurrent GNN and GNCA have less reliable predictions compared to Diff-FSA, which shows no variability.
**Note**: No textual content in other languages was detected. All labels and values are extracted with approximate precision based on visual alignment.