## Line Charts: Accuracy vs. #Sampled Reasoning Paths across 8 Datasets
### Overview
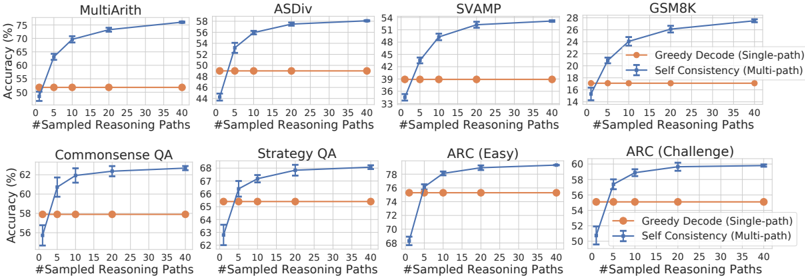
The image presents a grid of eight line charts, each evaluating the performance of two decoding strategies—"Greedy Decode (Single-path)" and "Self Consistency (Multi-path)"—across eight different reasoning datasets. The charts demonstrate how increasing the number of sampled reasoning paths affects the accuracy of the model.
### Components/Axes
* **Grid Layout:** 2 rows by 4 columns.
* **X-Axis:** "#Sampled Reasoning Paths" (Values: 0, 5, 10, 20, 40).
* **Y-Axis:** "Accuracy (%)" (Scale varies per chart).
* **Legend:**
* **Orange Circle:** "Greedy Decode (Single-path)" (Horizontal line).
* **Blue Cross/Plus with Error Bars:** "Self Consistency (Multi-path)" (Curved line).
* **Datasets:**
* Top Row: MultiArith, ASDiv, SVAMP, GSM8K
* Bottom Row: Commonsense QA, Strategy QA, ARC (Easy), ARC (Challenge)
### Detailed Analysis
In all eight charts, the "Greedy Decode" line is a flat horizontal line, serving as a baseline. The "Self Consistency" line starts below the Greedy Decode line at 0 paths, crosses it between 0 and 5 paths, and then exhibits a logarithmic growth curve that plateaus as the number of paths increases.
| Dataset | Greedy Decode (Approx) | Self Consistency (0 paths) | Self Consistency (5 paths) | Self Consistency (40 paths) |
| :--- | :--- | :--- | :--- | :--- |
| **MultiArith** | ~52% | ~48% | ~70% | ~76% |
| **ASDiv** | ~49% | ~44% | ~53% | ~58% |
| **SVAMP** | ~39% | ~35% | ~43% | ~53% |
| **GSM8K** | ~17% | ~14% | ~21% | ~27.5% |
| **Commonsense QA** | ~58% | ~55% | ~60.5% | ~62.5% |
| **Strategy QA** | ~65.5% | ~62.5% | ~65.5% | ~68% |
| **ARC (Easy)** | ~75.5% | ~68% | ~76% | ~79% |
| **ARC (Challenge)** | ~55% | ~50% | ~56% | ~59.5% |
*Note: Values are estimated based on visual inspection of the grid lines.*
### Key Observations
* **Consistent Trend:** Across all datasets, the Self Consistency method shows a sharp increase in accuracy when moving from 0 to 5 paths.
* **Diminishing Returns:** The slope of the Self Consistency curve flattens significantly after 10-20 paths. Moving from 20 to 40 paths yields only marginal accuracy gains.
* **Error Bars:** The Self Consistency data points include vertical error bars. These are most prominent at the lower end of the X-axis (0-5 paths) and generally decrease in size as the number of paths increases, indicating higher confidence/stability with more samples.
* **Crossover Point:** In every chart, the Self Consistency method underperforms the Greedy Decode baseline at 0 paths but surpasses it by the 5-path mark.
### Interpretation
The data demonstrates that "Self Consistency" (sampling multiple reasoning paths and taking a majority vote) is a robust technique for improving model accuracy compared to a single "Greedy Decode" pass.
* **Why it matters:** The consistent shape of the curves across diverse datasets (math, commonsense, strategy, science) suggests that the benefits of Self Consistency are universal across different types of reasoning tasks.
* **Efficiency vs. Accuracy:** Because the accuracy gains plateau after 10-20 paths, there is a clear trade-off between computational cost (more paths = more inference time) and accuracy. For most applications, 10-20 paths appear to be the "sweet spot" for optimal performance.
* **The "0" Path Anomaly:** The fact that Self Consistency starts lower than Greedy Decode at 0 paths suggests that the "Self Consistency" mechanism is inherently dependent on the aggregation of multiple samples. A single sample (0 paths) is insufficient to leverage the benefits of the majority-voting strategy, and may even introduce noise compared to a standard greedy decoding approach.