## Line Charts: Accuracy vs. Sampled Reasoning Paths Across Eight Datasets
### Overview
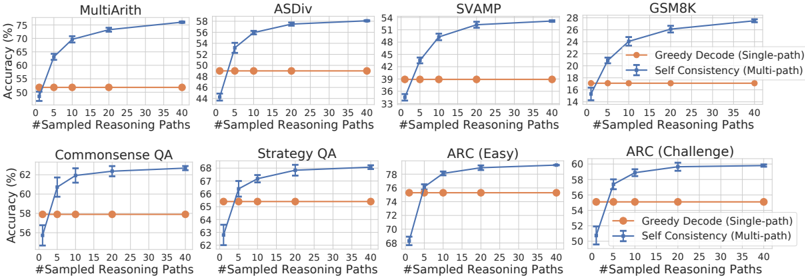
The image displays a 2x4 grid of eight line charts. Each chart compares the performance of two methods—"Greedy Decode (Single-path)" and "Self Consistency (Multi-path)"—on a specific reasoning or question-answering dataset. The charts collectively demonstrate how accuracy changes as the number of sampled reasoning paths increases.
### Components/Axes
* **Chart Titles (Datasets):** The eight datasets are, from top-left to bottom-right: MultiArith, ASDiv, SVAMP, GSM8K, Commonsense QA, Strategy QA, ARC (Easy), and ARC (Challenge).
* **X-Axis (All Charts):** Labeled "#Sampled Reasoning Paths". The axis markers are at 0, 5, 10, 15, 20, 25, 30, 35, and 40.
* **Y-Axis (All Charts):** Labeled "Accuracy (%)". The scale and range vary per chart to best fit the data.
* **Legend:** Located in the bottom-right corner of each individual chart. It defines two series:
* **Orange line with circle markers:** "Greedy Decode (Single-path)"
* **Blue line with square markers and error bars:** "Self Consistency (Multi-path)"
### Detailed Analysis
**Chart-by-Chart Data Extraction (Approximate Values):**
1. **MultiArith**
* **Greedy Decode (Orange):** Flat line at approximately 52% accuracy.
* **Self Consistency (Blue):** Starts at ~50% (0 paths), rises steeply to ~65% (5 paths), then continues a steady upward trend to ~75% (40 paths). Error bars are visible.
2. **ASDiv**
* **Greedy Decode (Orange):** Flat line at approximately 49% accuracy.
* **Self Consistency (Blue):** Starts at ~44% (0 paths), jumps to ~52% (5 paths), and increases gradually to ~58% (40 paths).
3. **SVAMP**
* **Greedy Decode (Orange):** Flat line at approximately 39% accuracy.
* **Self Consistency (Blue):** Starts at ~34% (0 paths), rises sharply to ~45% (5 paths), and climbs to ~54% (40 paths).
4. **GSM8K**
* **Greedy Decode (Orange):** Flat line at approximately 17% accuracy.
* **Self Consistency (Blue):** Starts at ~14% (0 paths), increases to ~22% (5 paths), and reaches ~28% (40 paths).
5. **Commonsense QA**
* **Greedy Decode (Orange):** Flat line at approximately 58% accuracy.
* **Self Consistency (Blue):** Starts at ~56% (0 paths), rises to ~61% (5 paths), and plateaus near ~62% (40 paths).
6. **Strategy QA**
* **Greedy Decode (Orange):** Flat line at approximately 65% accuracy.
* **Self Consistency (Blue):** Starts at ~63% (0 paths), increases to ~67% (5 paths), and reaches ~68% (40 paths).
7. **ARC (Easy)**
* **Greedy Decode (Orange):** Flat line at approximately 76% accuracy.
* **Self Consistency (Blue):** Starts at ~68% (0 paths), jumps to ~77% (5 paths), and climbs to ~79% (40 paths).
8. **ARC (Challenge)**
* **Greedy Decode (Orange):** Flat line at approximately 55% accuracy.
* **Self Consistency (Blue):** Starts at ~50% (0 paths), rises to ~57% (5 paths), and reaches ~60% (40 paths).
### Key Observations
1. **Consistent Trend:** In all eight datasets, the "Self Consistency (Multi-path)" method (blue line) shows a clear, monotonic increase in accuracy as the number of sampled reasoning paths increases from 0 to 40.
2. **Baseline Performance:** The "Greedy Decode (Single-path)" method (orange line) serves as a flat baseline, showing constant accuracy regardless of the x-axis value (which is logical, as it uses only one path).
3. **Diminishing Returns:** The most significant accuracy gain for the Self Consistency method typically occurs within the first 5-10 sampled paths. The rate of improvement slows but remains positive as more paths are added.
4. **Performance Gap:** The final accuracy gap between the two methods at 40 paths varies by dataset, from a modest ~4% (Commonsense QA, Strategy QA) to a substantial ~20% (MultiArith, SVAMP).
5. **Error Bars:** The blue line (Self Consistency) includes vertical error bars, indicating variability or confidence intervals in the measurements. The orange line (Greedy Decode) does not show error bars.
### Interpretation
This set of charts provides strong empirical evidence for the effectiveness of the "Self Consistency" decoding strategy over standard "Greedy Decode" for complex reasoning tasks. The core finding is that **aggregating multiple reasoning paths (sampling) leads to more accurate final answers than relying on a single, greedily-decoded path.**
The data suggests that the underlying reasoning process for these tasks has inherent variability or stochasticity. By generating multiple diverse reasoning chains and selecting the most consistent answer (the principle behind Self Consistency), the model can overcome errors present in any single chain. The steep initial rise in the blue lines indicates that even a small amount of sampling (5-10 paths) captures significant benefits, making the method practically efficient. The continued, though slower, improvement up to 40 paths shows that further sampling continues to refine performance.
The variation in the magnitude of improvement across datasets (e.g., large gains on arithmetic datasets like MultiArith vs. smaller gains on commonsense QA) implies that the benefit of multi-path sampling is particularly pronounced for tasks where the reasoning process is more complex or has a higher chance of containing a logical misstep that a single greedy path might commit to. This visualization effectively argues for moving beyond single-path generation in favor of ensemble-like methods for robust AI reasoning.