## Chart: Evolution Curves of LLM-based AHD Methods
### Overview
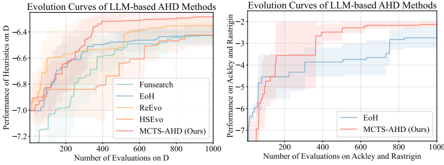
The image presents two line charts comparing the performance of different Large Language Model (LLM)-based Automated Heuristic Design (AHD) methods. The left chart shows the performance of heuristics on dataset "D", while the right chart shows the performance on "Ackley and Rastrigin". The x-axis represents the number of evaluations, and the y-axis represents the performance score. Shaded regions around the lines indicate uncertainty or variance in the performance.
### Components/Axes
**Left Chart:**
* **Title:** Evolution Curves of LLM-based AHD Methods
* **Y-axis:** Performance of Heuristics on D
* Scale: -7.2 to -6.4, with increments of 0.2.
* **X-axis:** Number of Evaluations on D
* Scale: 0 to 1000, with increments of 200.
* **Legend:** (Located on the right side of the left chart)
* Funsearch (color unclear, appears light gray/blue)
* EoH (light blue)
* ReEvo (light green)
* HSEvo (light orange/brown)
* MCTS-AHD (Ours) (light red/pink)
**Right Chart:**
* **Title:** Evolution Curves of LLM-based AHD Methods
* **Y-axis:** Performance on Ackley and Rastrigin
* Scale: -7 to -2, with increments of 1.
* **X-axis:** Number of Evaluations on Ackley and Rastrigin
* Scale: 0 to 1000, with increments of 200.
* **Legend:** (Located on the right side of the right chart)
* EoH (light blue)
* MCTS-AHD (Ours) (light red/pink)
### Detailed Analysis
**Left Chart (Performance of Heuristics on D):**
* **Funsearch:** The line starts around -7.0 and plateaus around -6.5 after approximately 400 evaluations.
* **EoH:** The line starts around -7.0 and plateaus around -6.5 after approximately 400 evaluations.
* **ReEvo:** The line starts around -7.1 and plateaus around -6.4 after approximately 400 evaluations.
* **HSEvo:** The line starts around -7.0 and plateaus around -6.4 after approximately 400 evaluations.
* **MCTS-AHD (Ours):** The line starts around -7.1 and plateaus around -6.4 after approximately 400 evaluations.
**Right Chart (Performance on Ackley and Rastrigin):**
* **EoH:** The line starts around -7.0 and plateaus around -3.5 after approximately 400 evaluations.
* **MCTS-AHD (Ours):** The line starts around -7.0 and plateaus around -2.5 after approximately 400 evaluations.
### Key Observations
* In the left chart, all methods converge to a similar performance level on dataset D.
* In the right chart, MCTS-AHD (Ours) outperforms EoH on the Ackley and Rastrigin datasets.
* The shaded regions indicate the variance in performance for each method.
* The performance improvement is most significant in the initial evaluations for all methods.
### Interpretation
The charts demonstrate the evolution of performance for different LLM-based AHD methods across two different problem sets. On dataset D, the methods converge to similar performance levels, suggesting that the dataset might not be complex enough to differentiate the methods effectively. However, on the Ackley and Rastrigin datasets, MCTS-AHD (Ours) shows a clear advantage over EoH, indicating its superior ability to optimize for these specific problems. The shaded regions highlight the robustness of each method, with narrower regions indicating more consistent performance. The initial rapid improvement suggests that the methods quickly learn effective heuristics, while the plateau indicates a limit to the achievable performance or a need for more sophisticated exploration strategies.