## Line Charts: Evolution Curves of LLM-based AHD Methods
### Overview
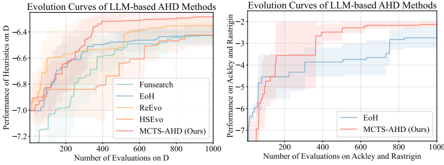
The image displays two side-by-side line charts comparing the performance of different "LLM-based AHD Methods" over a series of evaluations. The charts track performance improvement on two distinct sets of benchmark functions. Both charts use solid lines to represent the mean performance and shaded regions to indicate confidence intervals or variance.
### Components/Axes
**Left Chart:**
* **Title:** "Evolution Curves of LLM-based AHD Methods"
* **Y-axis Label:** "Performance on D"
* **Y-axis Scale:** Linear, ranging from approximately -7.2 to -6.4.
* **X-axis Label:** "Number of Evaluations on D"
* **X-axis Scale:** Linear, from 0 to 1000, with major ticks at 0, 200, 400, 600, 800, 1000.
* **Legend (Top-Left):** Contains five entries, each with a colored line and label:
* `Foresight` (Light blue line)
* `EoH` (Blue line)
* `ReEvo` (Green line)
* `HSEvo` (Orange line)
* `MCTS-AHD (Ours)` (Red line)
**Right Chart:**
* **Title:** "Evolution Curves of LLM-based AHD Methods"
* **Y-axis Label:** "Performance on Ackley and Rastrigin"
* **Y-axis Scale:** Linear, ranging from approximately -7 to -2.
* **X-axis Label:** "Number of Evaluations on Ackley and Rastrigin"
* **X-axis Scale:** Linear, from 0 to 1000, with major ticks at 0, 200, 400, 600, 800, 1000.
* **Legend (Bottom-Right):** Contains two entries:
* `EoH` (Blue line)
* `MCTS-AHD (Ours)` (Red line)
### Detailed Analysis
**Left Chart (Performance on D):**
* **Trend Verification:** All five methods show an upward trend (improving performance, moving from more negative to less negative values) as the number of evaluations increases. The curves generally rise steeply before 400 evaluations and then begin to plateau.
* **Data Series & Approximate Values:**
* `MCTS-AHD (Ours)` (Red): Starts near -7.1 at 0 evals. Shows the steepest initial rise, crossing -6.8 by ~200 evals. Continues to improve steadily, reaching approximately -6.5 by 1000 evals. It is the top-performing method for most of the evaluation budget.
* `EoH` (Blue): Starts around -7.0. Follows a similar but slightly lower trajectory than MCTS-AHD, ending near -6.55 at 1000 evals.
* `ReEvo` (Green): Starts near -7.0. Improves quickly but plateaus earlier, around -6.6 by 600 evals, and remains relatively flat thereafter.
* `HSEvo` (Orange): Starts around -7.05. Shows a more gradual, stepped improvement, ending near -6.65.
* `Foresight` (Light blue): Starts the lowest, near -7.15. Exhibits the most fluctuation and the slowest overall improvement, ending near -6.7.
* **Spatial Grounding:** The legend is positioned in the top-left corner of the plot area. The red line (`MCTS-AHD`) is consistently the highest (best) line after the initial ~100 evaluations.
**Right Chart (Performance on Ackley and Rastrigin):**
* **Trend Verification:** Both methods show a strong upward trend. The improvement is more dramatic than in the left chart, spanning a wider performance range.
* **Data Series & Approximate Values:**
* `MCTS-AHD (Ours)` (Red): Starts near -6.5 at 0 evals. Rises very sharply, crossing -4 by ~200 evals and -3 by ~400 evals. The curve continues to climb, ending at approximately -2.5 by 1000 evals.
* `EoH` (Blue): Starts lower, around -6.8. Also rises sharply but remains consistently below the red line. It crosses -4 by ~300 evals and ends near -3.5 at 1000 evals.
* **Spatial Grounding:** The legend is positioned in the bottom-right corner of the plot area. The red line (`MCTS-AHD`) is clearly and consistently above the blue line (`EoH`) throughout the entire evaluation range.
### Key Observations
1. **Consistent Superiority:** The method labeled `MCTS-AHD (Ours)` outperforms all other compared methods on both benchmark sets ("D" and "Ackley and Rastrigin").
2. **Performance Gap:** The performance gap between `MCTS-AHD` and the next-best method (`EoH`) is more pronounced on the "Ackley and Rastrigin" functions (right chart) than on the "D" functions (left chart).
3. **Convergence Behavior:** All methods show rapid initial improvement that slows over time, a typical pattern in optimization. `MCTS-AHD` appears to maintain a better rate of improvement for longer.
4. **Variance:** The shaded confidence intervals suggest that `MCTS-AHD` has comparable or slightly tighter variance than `EoH`, indicating stable performance.
### Interpretation
The data demonstrates the effectiveness of the proposed `MCTS-AHD` method for the task of LLM-based Automated Heuristic Design (AHD). Its consistent top performance across two different sets of benchmark problems suggests robustness and generalizability. The steeper learning curve on the more complex "Ackley and Rastrigin" functions (right chart) is particularly notable, indicating that `MCTS-AHD` may be especially efficient at navigating difficult, multi-modal optimization landscapes. The comparison establishes a clear performance hierarchy among the tested algorithms, with `MCTS-AHD` leading, followed generally by `EoH` and `ReEvo`. The charts serve as empirical evidence for the claimed advantage of the authors' method.