## Line Graphs: Evolution Curves of LLM-based AHD Methods
### Overview
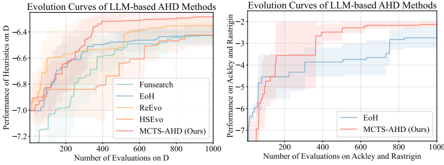
The image contains two line graphs comparing the performance evolution of LLM-based AHD (Automated Heuristic Design) methods across different evaluation metrics and datasets. The left graph focuses on performance on dataset "D," while the right graph evaluates performance on the Ackley and Rastrigin optimization benchmarks. Both graphs show stepwise improvement curves with shaded confidence intervals.
### Components/Axes
#### Left Graph (Performance on D)
- **Y-axis**: "Performance of Heuristics on D" (values: -7.2 to -6.4)
- **X-axis**: "Number of Evaluations on D" (200 to 1000)
- **Legend**:
- Blue: Funsearch
- Dark Blue: EoH
- Orange: ReEvo
- Teal: HSEvo
- Red: MCTS-AHD (Ours)
#### Right Graph (Performance on Ackley and Rastrigin)
- **Y-axis**: "Performance on Ackley and Rastrigin" (values: -5 to -2)
- **X-axis**: "Number of Evaluations on Ackley and Rastrigin" (200 to 1000)
- **Legend**:
- Blue: EoH
- Red: MCTS-AHD (Ours)
### Detailed Analysis
#### Left Graph Trends
1. **Funsearch (Blue)**: Starts at ~-7.0 (200 evaluations), rises to ~-6.6 (1000 evaluations). Steep initial climb, then plateaus.
2. **EoH (Dark Blue)**: Begins at ~-6.8 (200), improves to ~-6.4 (1000). Gradual, consistent ascent.
3. **ReEvo (Orange)**: Starts at ~-6.6 (200), reaches ~-6.4 (1000). Moderate improvement.
4. **HSEvo (Teal)**: Begins at ~-6.8 (200), ends at ~-6.6 (1000). Slow, steady progress.
5. **MCTS-AHD (Red)**: Starts at ~-6.2 (200), peaks at ~-6.4 (1000). Highest performance throughout.
#### Right Graph Trends
1. **EoH (Blue)**: Starts at ~-5.0 (200), improves to ~-2.5 (1000). Sharp initial rise, then stabilizes.
2. **MCTS-AHD (Red)**: Begins at ~-5.5 (200), reaches ~-2.0 (1000). Outperforms EoH consistently.
### Key Observations
1. **MCTS-AHD Dominance**: In both graphs, MCTS-AHD (Ours) achieves the highest performance across all evaluation counts, with the largest margin in the Ackley/Rastrigin benchmark.
2. **Convergence Patterns**: All methods show diminishing returns after ~600 evaluations, with performance curves flattening.
3. **Confidence Intervals**: Shaded regions indicate variability. The left graph shows wider uncertainty (e.g., Funsearch’s ±0.3 range at 1000 evaluations), while the right graph has tighter bounds (±0.2 for MCTS-AHD).
### Interpretation
The data demonstrates that **MCTS-AHD (Ours)** consistently outperforms other methods in both dataset-specific (D) and general optimization (Ackley/Rastrigin) tasks. The performance gains are most pronounced in the early evaluation stages (200–400 evaluations), suggesting rapid initial learning. The Ackley/Rastrigin benchmark (right graph) reveals MCTS-AHD’s superior generalization capability, as it achieves near-optimal results faster than EoH. The shaded confidence intervals imply that MCTS-AHD’s performance is more stable, with less variance across trials. These results position MCTS-AHD as a robust solution for LLM-based AHD, particularly in complex optimization landscapes.