## Stacked Bar Chart: GPT-2 xl Head Distribution by Layer
### Overview
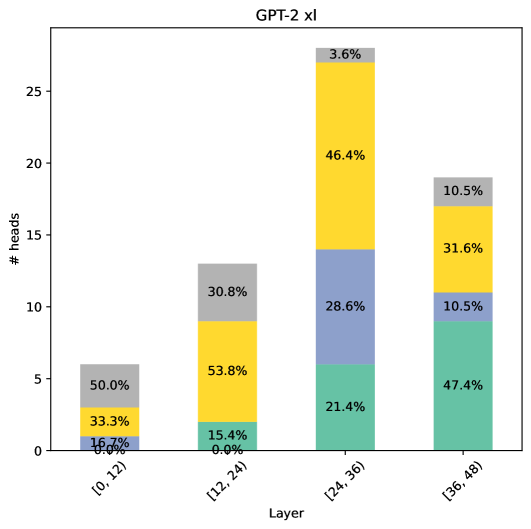
The image is a stacked bar chart visualizing the distribution of attention heads across different layers in the GPT-2 xl model. The x-axis represents the layer groups, and the y-axis represents the number of heads. Each bar is segmented into colored sections, each representing a different type of attention head. The percentage of each head type within each layer group is labeled on the bar segments.
### Components/Axes
* **Title:** GPT-2 xl
* **X-axis:** Layer, with categories: \[0, 12), \[12, 24), \[24, 36), \[36, 48)
* **Y-axis:** # heads, with a scale from 0 to 25 in increments of 5.
* **Bar Segments (Colors and Approximate Values):**
* Teal: Represents the first segment of each bar.
* \[0, 12): 0.0%
* \[12, 24): 15.4%
* \[24, 36): 21.4%
* \[36, 48): 47.4%
* Light Blue: Represents the second segment of each bar.
* \[0, 12): 16.7%
* \[12, 24): 0.0%
* \[24, 36): 28.6%
* \[36, 48): 10.5%
* Yellow: Represents the third segment of each bar.
* \[0, 12): 33.3%
* \[12, 24): 53.8%
* \[24, 36): 46.4%
* \[36, 48): 31.6%
* Grey: Represents the fourth segment of each bar.
* \[0, 12): 50.0%
* \[12, 24): 30.8%
* \[24, 36): 3.6%
* \[36, 48): 10.5%
### Detailed Analysis
* **Layer \[0, 12):**
* Teal: 0.0%
* Light Blue: 16.7%
* Yellow: 33.3%
* Grey: 50.0%
* **Layer \[12, 24):**
* Teal: 15.4%
* Light Blue: 0.0%
* Yellow: 53.8%
* Grey: 30.8%
* **Layer \[24, 36):**
* Teal: 21.4%
* Light Blue: 28.6%
* Yellow: 46.4%
* Grey: 3.6%
* **Layer \[36, 48):**
* Teal: 47.4%
* Light Blue: 10.5%
* Yellow: 31.6%
* Grey: 10.5%
### Key Observations
* The distribution of head types varies significantly across the layers.
* The teal segment increases as the layer increases.
* The light blue segment is highest in the first layer group and then decreases.
* The yellow segment is highest in the second layer group.
* The grey segment is highest in the first layer group and then decreases.
### Interpretation
The stacked bar chart illustrates how the composition of attention heads changes across different layer groups in the GPT-2 xl model. The data suggests that different types of attention heads may be more prominent or specialized in certain layers. The increasing proportion of the teal segment in later layers could indicate a shift in the type of attention being utilized as the model processes information through its layers. The other segments decrease as the layer increases. The chart provides insights into the model's internal workings and how it distributes its attention mechanisms across its depth.