## Stacked Bar Chart: GPT-2 xl Layer Analysis
### Overview
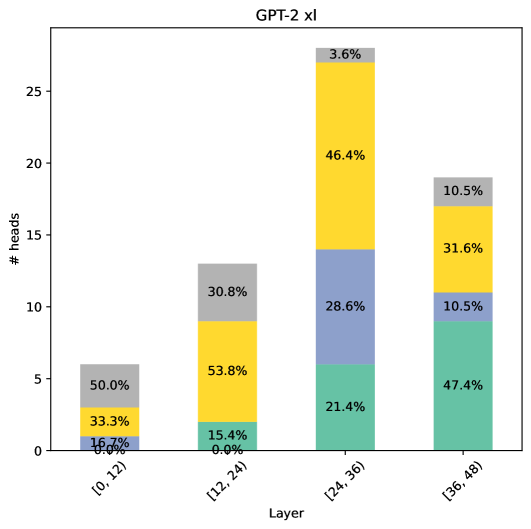
The image presents a stacked bar chart visualizing the distribution of "# heads" across different layers of the GPT-2 xl model. The chart displays the percentage contribution of different components within each layer, represented by different colored segments within each bar. The x-axis represents the layer range, and the y-axis represents the number of heads.
### Components/Axes
* **Title:** GPT-2 xl
* **X-axis Label:** Layer
* **X-axis Markers:** \[0, 12], \[12, 24], \[24, 36], \[36, 48]
* **Y-axis Label:** # heads
* **Y-axis Scale:** 0 to 28 (approximately)
* **Colors/Legend (inferred from stacking order):**
* Lightest Grey: 3.6%
* Yellow: 46.4%
* Medium Grey: 30.8%
* Light Blue: 28.6%
* Darker Grey: 33.3%
* Olive Green: 47.4%
* Tan: 10.5%
* Dark Blue: 21.4%
* Darkest Grey: 16.0%
* Light Tan: 15.4%
* Darker Tan: 31.6%
### Detailed Analysis
The chart consists of four stacked bars, each representing a layer range. The height of each segment within a bar indicates the proportion of "# heads" belonging to that segment.
* **Layer \[0, 12]:**
* Darkest Grey: Approximately 16.0%
* Darker Grey: Approximately 33.3%
* Light Tan: Approximately 50.0%
* Total # heads: Approximately 5
* **Layer \[12, 24]:**
* Darkest Grey: Approximately 15.4%
* Light Tan: Approximately 53.8%
* Medium Grey: Approximately 30.8%
* Total # heads: Approximately 15
* **Layer \[24, 36]:**
* Darkest Grey: Approximately 21.4%
* Light Blue: Approximately 28.6%
* Yellow: Approximately 46.4%
* Lightest Grey: Approximately 3.6%
* Total # heads: Approximately 22
* **Layer \[36, 48]:**
* Tan: Approximately 10.5%
* Darker Tan: Approximately 31.6%
* Olive Green: Approximately 47.4%
* Lightest Grey: Approximately 10.5%
* Total # heads: Approximately 20
### Key Observations
* The distribution of "# heads" varies significantly across layers.
* Layer \[24, 36] has the highest total number of heads (approximately 22).
* Layer \[0, 12] has the lowest total number of heads (approximately 5).
* The color Yellow is most prominent in the \[24, 36] layer.
* Olive Green is most prominent in the \[36, 48] layer.
* The Darkest Grey segment is present in all layers, but its proportion varies.
### Interpretation
The chart illustrates the composition of "# heads" within different layers of the GPT-2 xl model. The varying distributions suggest that different layers may focus on different aspects of the model's functionality, as reflected in the proportion of each component. The higher number of heads in the \[24, 36] layer could indicate that this layer is particularly important for the model's overall performance. The differences in color distribution across layers suggest that the model's internal representation of information changes as data flows through the layers. The consistent presence of the Darkest Grey segment across all layers suggests that this component is fundamental to the model's operation at all levels. The chart provides a visual representation of the model's internal structure and could be used to identify areas for further investigation or optimization.