## Stacked Bar Chart: GPT-2 xl Layer Head Distribution
### Overview
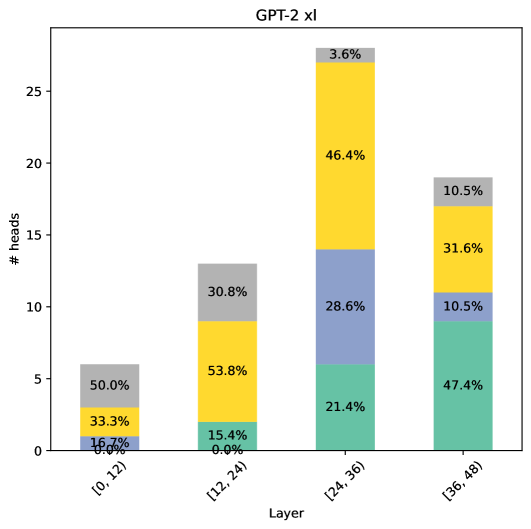
The chart visualizes the distribution of attention heads across four layer ranges in the GPT-2 xl model. Each bar represents a layer range, with segments colored to indicate proportional contributions from different head types. The y-axis measures the number of heads (0-25), while the x-axis categorizes layers into quartiles.
### Components/Axes
- **X-axis (Layer Ranges)**:
- [0,12)
- [12,24)
- [24,36)
- [36,48)
- **Y-axis**: Number of attention heads (# heads)
- **Legend**:
- Gray: 50.0% (top segment)
- Yellow: 46.4% (middle segment)
- Blue: 28.6% (lower segment)
- Green: 21.4% (bottom segment)
### Detailed Analysis
1. **Layer [0,12)**:
- Gray: 50.0% (3 heads)
- Yellow: 33.3% (2 heads)
- Blue: 16.7% (1 head)
- Total: 6 heads
2. **Layer [12,24)**:
- Gray: 30.8% (4 heads)
- Yellow: 53.8% (7 heads)
- Blue: 15.4% (2 heads)
- Total: 13 heads
3. **Layer [24,36)**:
- Yellow: 46.4% (12 heads)
- Blue: 28.6% (7 heads)
- Green: 21.4% (5 heads)
- Total: 24 heads
4. **Layer [36,48)**:
- Yellow: 31.6% (8 heads)
- Green: 47.4% (12 heads)
- Blue: 10.5% (3 heads)
- Gray: 10.5% (3 heads)
- Total: 26 heads
### Key Observations
1. **Layer [24,36)** has the highest total heads (24) with yellow dominating (46.4%).
2. **Layer [36,48)** shows the largest green segment (47.4%, 12 heads), suggesting a significant architectural shift.
3. **Gray segments** decrease from 50.0% in [0,12) to 10.5% in [36,48), indicating reduced prevalence of this head type in deeper layers.
4. **Yellow segments** peak in [12,24) (53.8%) and remain prominent in later layers.
### Interpretation
The data suggests a progressive architectural evolution in GPT-2 xl's attention mechanisms:
- Early layers ([0,12)) show balanced head distribution with gray heads dominating.
- Middle layers ([12,24)) exhibit increased yellow head prevalence, possibly indicating enhanced pattern recognition capabilities.
- Deeper layers ([24,36) and [36,48)) show a shift toward green and yellow heads, with [36,48) having the highest green head proportion (47.4%), potentially reflecting specialized processing roles in later layers.
- The total head count increases from 6 to 26 across layers, aligning with typical transformer scaling patterns where deeper layers have more complex attention mechanisms.
The distribution patterns may correlate with the model's ability to handle different abstraction levels of language processing, with deeper layers showing more specialized head configurations.