## Chart: Cumulative Average NLL for Long Documents and Code
### Overview
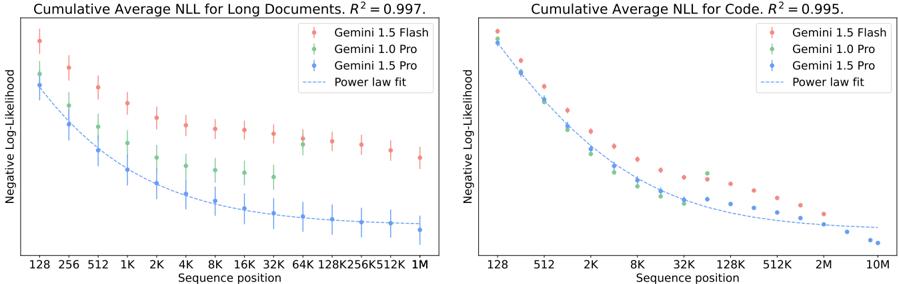
The image contains two line charts comparing the cumulative average negative log-likelihood (NLL) for different Gemini models (1.5 Flash, 1.0 Pro, and 1.5 Pro) on long documents (left) and code (right). The x-axis represents the sequence position, and the y-axis represents the negative log-likelihood. A power law fit is also plotted on each chart.
### Components/Axes
**Left Chart:**
* **Title:** Cumulative Average NLL for Long Documents. R² = 0.997.
* **Y-axis:** Negative Log-Likelihood
* **X-axis:** Sequence position
* Scale: 128, 256, 512, 1K, 2K, 4K, 8K, 16K, 32K, 64K, 128K, 256K, 512K, 1M
* **Legend:** Located in the top-right corner.
* Gemini 1.5 Flash (Red)
* Gemini 1.0 Pro (Green)
* Gemini 1.5 Pro (Blue)
* Power law fit (Dashed Blue)
**Right Chart:**
* **Title:** Cumulative Average NLL for Code. R² = 0.995.
* **Y-axis:** Negative Log-Likelihood
* **X-axis:** Sequence position
* Scale: 128, 512, 2K, 8K, 32K, 128K, 512K, 2M, 10M
* **Legend:** Located in the top-right corner.
* Gemini 1.5 Flash (Red)
* Gemini 1.0 Pro (Green)
* Gemini 1.5 Pro (Blue)
* Power law fit (Dashed Blue)
### Detailed Analysis
**Left Chart (Long Documents):**
* **Gemini 1.5 Flash (Red):** The NLL starts at approximately -0.2 and decreases slightly, remaining relatively flat with sequence position. Error bars are present, indicating variability.
* 128: ~-0.2
* 1M: ~-0.25
* **Gemini 1.0 Pro (Green):** The NLL starts at approximately -0.3 and decreases slightly, remaining relatively flat with sequence position. Error bars are present, indicating variability.
* 128: ~-0.3
* 1M: ~-0.35
* **Gemini 1.5 Pro (Blue):** The NLL starts at approximately -0.4 and decreases more significantly than the other two models, following the power law fit. Error bars are present, indicating variability.
* 128: ~-0.4
* 1M: ~-0.5
* **Power law fit (Dashed Blue):** A curve that decreases sharply at the beginning and then flattens out.
**Right Chart (Code):**
* **Gemini 1.5 Flash (Red):** The NLL starts at approximately -0.1 and decreases gradually with sequence position.
* 128: ~-0.1
* 10M: ~-0.5
* **Gemini 1.0 Pro (Green):** The NLL starts at approximately -0.15 and decreases gradually with sequence position.
* 128: ~-0.15
* 10M: ~-0.6
* **Gemini 1.5 Pro (Blue):** The NLL starts at approximately -0.2 and decreases gradually with sequence position, closely following the power law fit.
* 128: ~-0.2
* 10M: ~-0.7
* **Power law fit (Dashed Blue):** A curve that decreases sharply at the beginning and then flattens out.
### Key Observations
* For long documents, Gemini 1.5 Pro has the lowest NLL and follows the power law fit more closely than the other models. Gemini 1.5 Flash and 1.0 Pro have relatively flat NLL curves.
* For code, all three models show a decreasing NLL with increasing sequence position, with Gemini 1.5 Pro consistently having the lowest NLL.
* The R² values are very high (0.997 and 0.995), indicating a good fit of the power law to the data.
* The range of sequence positions is different between the two charts. The "Long Documents" chart goes up to 1M, while the "Code" chart goes up to 10M.
### Interpretation
The charts suggest that Gemini 1.5 Pro performs better (lower NLL) than Gemini 1.5 Flash and 1.0 Pro on both long documents and code. The power law fit indicates a diminishing return in terms of NLL reduction as the sequence position increases. The higher R² values suggest that the power law is a good model for the relationship between sequence position and NLL. The error bars on the "Long Documents" chart indicate that there is some variability in the NLL for these models, particularly at shorter sequence positions. The difference in performance between the models is more pronounced for code than for long documents.