## [Chart Type]: Dual Scatter Plots with Power Law Fit
### Overview
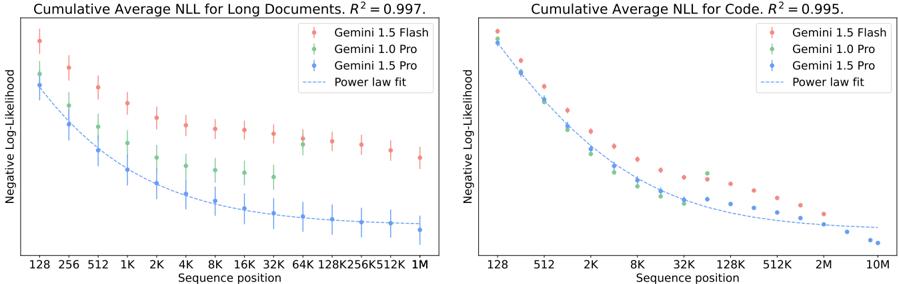
The image displays two side-by-side scatter plots comparing the performance of three AI models (Gemini 1.5 Flash, Gemini 1.0 Pro, and Gemini 1.5 Pro) on two different tasks. The charts plot the Cumulative Average Negative Log-Likelihood (NLL) against the Sequence position on a logarithmic scale. Both charts include a dashed line representing a power law fit to the data, with high R² values indicating a strong fit.
### Components/Axes
**Common Elements (Both Charts):**
* **Y-Axis Title:** "Negative Log-Likelihood"
* **Y-Axis Scale:** Linear scale from 0 to 12, with major ticks at 0, 2, 4, 6, 8, 10, 12.
* **X-Axis Title:** "Sequence position"
* **X-Axis Scale:** Logarithmic scale. The specific tick labels differ between charts.
* **Legend (Top-Right of each plot):**
* Red diamond with error bars: "Gemini 1.5 Flash"
* Green diamond with error bars: "Gemini 1.0 Pro"
* Blue diamond with error bars: "Gemini 1.5 Pro"
* Dashed grey line: "Power law fit"
**Left Chart: "Cumulative Average NLL for Long Documents, R² = 0.997."**
* **X-Axis Ticks:** 128, 256, 512, 1K, 2K, 4K, 8K, 16K, 32K, 64K, 128K, 256K, 512K, 1M.
* **Data Range:** Sequence positions from 128 to 1,048,576 (1M).
**Right Chart: "Cumulative Average NLL for Code, R² = 0.995."**
* **X-Axis Ticks:** 128, 512, 2K, 8K, 32K, 128K, 512K, 2M, 10M.
* **Data Range:** Sequence positions from 128 to 10,000,000 (10M).
### Detailed Analysis
**Left Chart (Long Documents):**
* **Trend Verification:** All three model series show a clear downward trend, with NLL decreasing as sequence position increases. The curves flatten out at longer sequence lengths.
* **Data Series & Values (Approximate):**
* **Gemini 1.5 Flash (Red):** Starts highest at ~11.5 (128), decreases to ~5.5 (1M). Has the largest error bars.
* **Gemini 1.0 Pro (Green):** Starts at ~10 (128), decreases to ~4.5 (1M).
* **Gemini 1.5 Pro (Blue):** Starts lowest at ~9 (128), decreases to ~3.5 (1M). Has the smallest error bars.
* **Power Law Fit:** The dashed line closely follows the Gemini 1.5 Pro (blue) data points, suggesting it is the primary fit. The R² value of 0.997 indicates an excellent fit.
**Right Chart (Code):**
* **Trend Verification:** All three model series show a steep initial decline in NLL, which then gradually flattens. The overall NLL values are lower than for long documents at comparable sequence lengths.
* **Data Series & Values (Approximate):**
* **Gemini 1.5 Flash (Red):** Starts at ~11 (128), decreases to ~4 (10M).
* **Gemini 1.0 Pro (Green):** Starts at ~10 (128), decreases to ~3.5 (10M).
* **Gemini 1.5 Pro (Blue):** Starts at ~9.5 (128), decreases to ~2.5 (10M).
* **Power Law Fit:** The dashed line again aligns most closely with the Gemini 1.5 Pro (blue) data. The R² value of 0.995 also indicates a very strong fit.
### Key Observations
1. **Consistent Model Ranking:** In both tasks (Long Documents and Code), the performance hierarchy is consistent: Gemini 1.5 Pro (blue) has the lowest NLL (best performance), followed by Gemini 1.0 Pro (green), with Gemini 1.5 Flash (red) having the highest NLL.
2. **Task Difference:** The models achieve lower NLL scores on the "Code" task compared to "Long Documents" at similar sequence lengths, suggesting code may be more predictable for these models.
3. **Scaling Behavior:** The power law relationship (NLL ∝ sequence_position^(-α)) holds extremely well for all models on both tasks, as evidenced by the high R² values (>0.995). This indicates predictable scaling of performance with context length.
4. **Error Bar Variance:** Gemini 1.5 Flash consistently shows larger error bars (greater variance in performance) than the Pro models, especially at shorter sequence lengths.
### Interpretation
The data demonstrates a clear and predictable power-law scaling of model performance (as measured by lower Negative Log-Likelihood) with increasing sequence context length. This is a fundamental property of large language models, showing that they become more accurate predictors as they process more context.
The consistent ranking of the models suggests that the "Pro" variants are more efficient at utilizing long-range context than the "Flash" variant, with the latest generation (1.5 Pro) outperforming the previous generation (1.0 Pro). The steeper initial decline and lower overall NLL for the "Code" task imply that the structured, syntactic nature of code provides stronger predictive signals for the models compared to the more varied and potentially noisier natural language in long documents.
The near-perfect R² values for the power law fits are significant. They not only validate the scaling hypothesis but also provide a reliable means to extrapolate and predict model performance at context lengths beyond those explicitly tested. This has practical implications for determining the necessary context window size for specific applications. The larger error bars for Gemini 1.5 Flash might indicate less stability or greater sensitivity to input variation when working with limited context.