## Line Graphs: Cumulative Average NLL for Long Documents and Code
### Overview
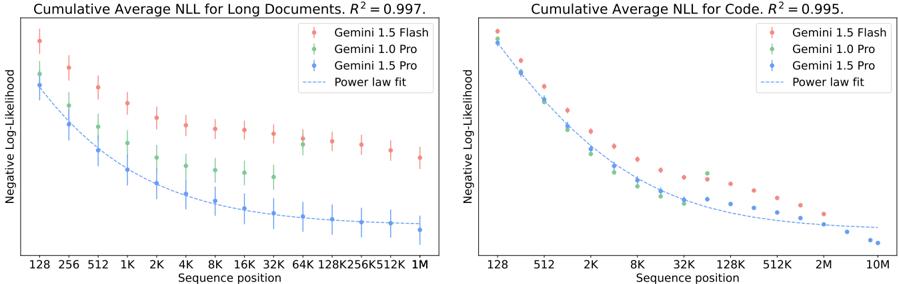
The image contains two side-by-side line graphs comparing the performance of three Gemini models (Gemini 1.5 Flash, Gemini 1.0 Pro, Gemini 1.5 Pro) across sequence positions for long documents and code. Both graphs show a strong negative log-likelihood (NLL) trend with high R² values (0.997 and 0.995), indicating a near-perfect power law fit.
---
### Components/Axes
- **Left Graph**:
- **Title**: "Cumulative Average NLL for Long Documents. R² = 0.997."
- **Y-Axis**: "Negative Log-Likelihood" (log scale, decreasing downward).
- **X-Axis**: "Sequence position" (log scale, increasing rightward: 128, 256, 512, 1K, 2K, 4K, 8K, 16K, 32K, 64K, 128K, 256K, 512K, 1M).
- **Legend**: Top-right, with red (Gemini 1.5 Flash), green (Gemini 1.0 Pro), blue (Gemini 1.5 Pro), and dashed line (Power law fit).
- **Right Graph**:
- **Title**: "Cumulative Average NLL for Code. R² = 0.995."
- **Y-Axis**: "Negative Log-Likelihood" (log scale, decreasing downward).
- **X-Axis**: "Sequence position" (log scale, increasing rightward: 128, 512, 2K, 8K, 32K, 128K, 512K, 2M, 10M).
- **Legend**: Top-right, identical to the left graph.
---
### Detailed Analysis
#### Left Graph (Long Documents)
- **Data Points**:
- **Gemini 1.5 Flash (red)**: Starts at ~-1.5 (128) and declines to ~-3.5 (1M), with error bars shrinking at longer positions.
- **Gemini 1.0 Pro (green)**: Starts at ~-1.2 (128) and declines to ~-3.2 (1M), with larger error bars than Gemini 1.5 Flash.
- **Gemini 1.5 Pro (blue)**: Starts at ~-1.0 (128) and declines to ~-3.8 (1M), with the smallest error bars.
- **Power Law Fit**: Dashed line closely tracks all data points, confirming the trend.
#### Right Graph (Code)
- **Data Points**:
- **Gemini 1.5 Flash (red)**: Starts at ~-1.4 (128) and declines to ~-4.0 (10M), with error bars shrinking at longer positions.
- **Gemini 1.0 Pro (green)**: Starts at ~-1.3 (128) and declines to ~-3.8 (10M), with larger error bars than Gemini 1.5 Flash.
- **Gemini 1.5 Pro (blue)**: Starts at ~-1.1 (128) and declines to ~-4.2 (10M), with the smallest error bars.
- **Power Law Fit**: Dashed line aligns tightly with data points, mirroring the left graph’s trend.
---
### Key Observations
1. **Consistent Trends**: Both graphs show a steep decline in negative log-likelihood as sequence position increases, following a power law.
2. **Model Performance**:
- Gemini 1.5 Pro (blue) consistently outperforms other models (lowest NLL).
- Gemini 1.5 Flash (red) outperforms Gemini 1.0 Pro (green) in both tasks.
3. **Error Bars**: Smaller error bars at longer sequence positions suggest higher precision in measurements.
4. **R² Values**: Both graphs have near-perfect fits (0.995–0.997), validating the power law model.
---
### Interpretation
- **Model Efficiency**: Gemini 1.5 Pro’s superior performance (lowest NLL) suggests it is optimized for long-context tasks, possibly due to architectural improvements or training data.
- **Scalability**: The power law fit indicates that model performance scales predictably with sequence length, a critical insight for deploying models in long-document or code-generation tasks.
- **Task-Specific Behavior**: While trends are similar for documents and code, the steeper decline in the code graph (right) implies models handle code with greater efficiency at longer sequences.
- **Uncertainty**: Error bars are smallest for Gemini 1.5 Pro, indicating more reliable measurements, likely due to its advanced architecture reducing variability.
This analysis highlights the importance of model architecture and training in handling long-context tasks, with Gemini 1.5 Pro emerging as the most robust choice.