## Chart: C<sup>(e)</sup>(T) vs. T for varying x
### Overview
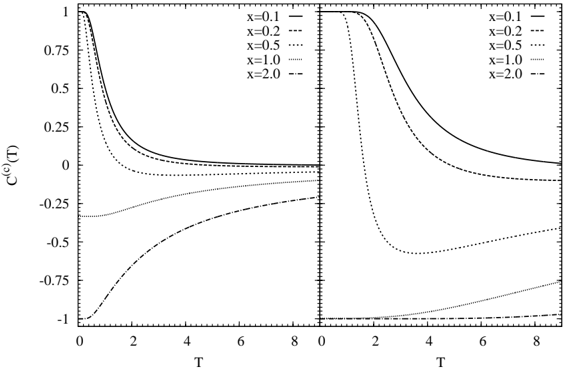
The image presents a line chart displaying the relationship between C<sup>(e)</sup>(T) and T for different values of 'x'. The chart is divided into two panels, likely representing different conditions or perspectives on the same data. Each panel contains five lines, each corresponding to a specific 'x' value.
### Components/Axes
* **X-axis:** Labeled "T", ranging from approximately 0 to 8. The scale appears linear.
* **Y-axis:** Labeled "C<sup>(e)</sup>(T)", ranging from approximately -1 to 0.8. The scale appears linear.
* **Legend:** Located in the top-right corner of each panel, listing the 'x' values and their corresponding line styles:
* x = 0.1 (solid line)
* x = 0.2 (dashed line)
* x = 0.5 (dotted line)
* x = 1.0 (dash-dot line)
* x = 2.0 (long dash-dot line)
### Detailed Analysis or Content Details
**Panel 1 (Left):**
* **x = 0.1 (solid line):** Starts at approximately 0.75, rapidly decreases to around 0.1 at T=1, and then slowly approaches 0 as T increases.
* **x = 0.2 (dashed line):** Starts at approximately 0.5, decreases to around -0.1 at T=1, and then plateaus around -0.1 to -0.2 for higher T values.
* **x = 0.5 (dotted line):** Starts near 0.2, decreases to approximately -0.25 at T=1, and then remains relatively constant around -0.25 to -0.3.
* **x = 1.0 (dash-dot line):** Starts near 0, decreases to approximately -0.5 at T=1, and then continues to decrease, reaching around -0.75 at T=8.
* **x = 2.0 (long dash-dot line):** Starts near 0, decreases rapidly to approximately -1 at T=1, and remains close to -1 for higher T values.
**Panel 2 (Right):**
* **x = 0.1 (solid line):** Starts at approximately 0.75, rapidly decreases to around 0.1 at T=1, and then slowly approaches 0 as T increases.
* **x = 0.2 (dashed line):** Starts at approximately 0.5, decreases to around -0.1 at T=1, and then plateaus around -0.1 to -0.2 for higher T values.
* **x = 0.5 (dotted line):** Starts near 0.2, decreases to approximately -0.25 at T=1, and then remains relatively constant around -0.25 to -0.3.
* **x = 1.0 (dash-dot line):** Starts near 0, decreases to approximately -0.5 at T=1, and then continues to decrease, reaching around -0.75 at T=8.
* **x = 2.0 (long dash-dot line):** Starts near 0, decreases rapidly to approximately -1 at T=1, and remains close to -1 for higher T values.
The two panels appear to be identical.
### Key Observations
* As 'x' increases, the initial value of C<sup>(e)</sup>(T) tends to decrease.
* For all 'x' values, C<sup>(e)</sup>(T) generally decreases as T increases, especially in the initial range (T=0 to T=1).
* The rate of decrease varies with 'x'; higher 'x' values exhibit a more rapid initial decrease.
* For x = 2.0, C<sup>(e)</sup>(T) quickly reaches and remains near -1.
* The lines for x=0.1, x=0.2, and x=0.5 appear to converge as T increases.
### Interpretation
The chart likely represents a system where C<sup>(e)</sup>(T) is a function of temperature (T) and a parameter 'x'. The parameter 'x' could represent a concentration, a scaling factor, or another relevant variable in the system. The two panels being identical suggests that the system's behavior is consistent across different experimental setups or conditions.
The decreasing trend of C<sup>(e)</sup>(T) with increasing T suggests a process where the quantity represented by C<sup>(e)</sup>(T) is consumed or diminished as temperature rises. The different curves for varying 'x' indicate that the rate and extent of this consumption are influenced by the value of 'x'.
The convergence of the curves for lower 'x' values at higher temperatures suggests that the system reaches a state where the influence of 'x' becomes less significant. The rapid decrease and stabilization at -1 for x=2.0 could indicate a saturation effect or a complete consumption of the quantity represented by C<sup>(e)</sup>(T) at higher 'x' values.
Without further context, it's difficult to determine the specific physical or chemical process being modeled. However, the chart provides valuable insights into the relationship between C<sup>(e)</sup>(T), T, and 'x', and could be used to optimize or control the system's behavior.