## Line Chart: Model Performance Comparison
### Overview
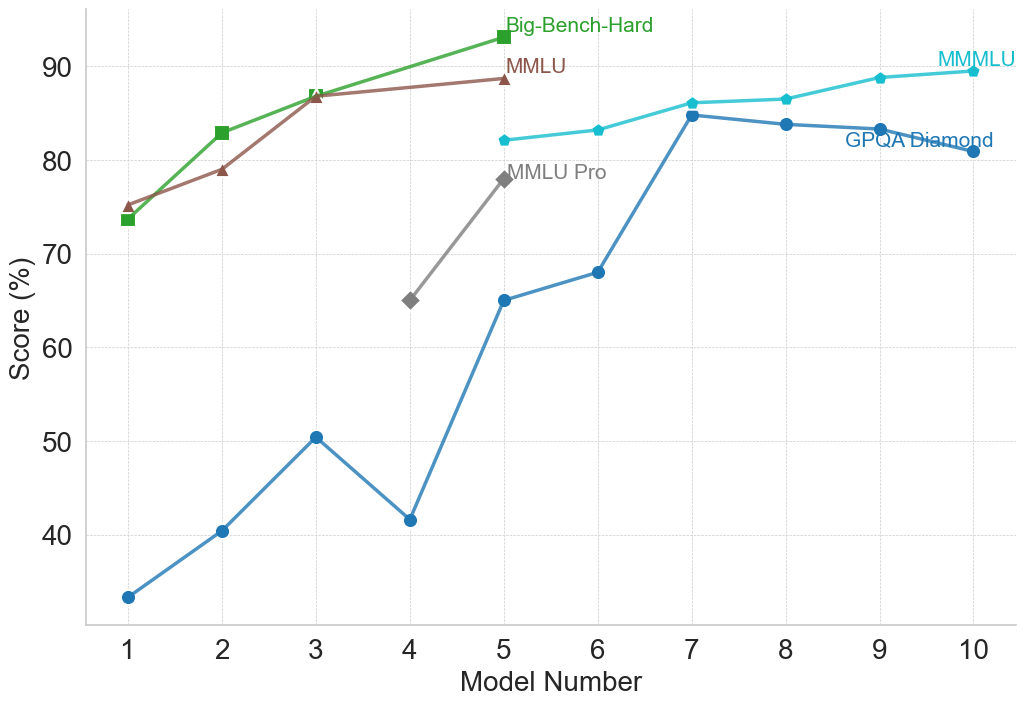
The image is a line chart comparing the performance of different models on various benchmarks. The chart displays the "Score (%)" on the y-axis against the "Model Number" on the x-axis. There are four data series, each representing a different benchmark: "Big-Bench-Hard", "MMLU", "MMMLU", "GPQA Diamond", and "MMLU Pro".
### Components/Axes
* **X-axis:** "Model Number" ranging from 1 to 10.
* **Y-axis:** "Score (%)" ranging from 40 to 90, with gridlines at intervals of 10.
* **Legend:** Located at the top of the chart, identifying each data series by color and name:
* Green squares: "Big-Bench-Hard"
* Brown triangles: "MMLU"
* Light blue circles: "MMMLU"
* Dark blue circles: "GPQA Diamond"
* Gray diamonds: "MMLU Pro"
### Detailed Analysis
**1. Big-Bench-Hard (Green Squares):**
* Trend: Generally increasing, with a slight plateau towards the end.
* Data Points:
* Model 1: ~74%
* Model 2: ~83%
* Model 3: ~87%
* Model 4: ~90%
**2. MMLU (Brown Triangles):**
* Trend: Increasing, then plateauing.
* Data Points:
* Model 1: ~75%
* Model 2: ~79%
* Model 3: ~87%
* Model 4: ~89%
**3. MMMLU (Light Blue Circles):**
* Trend: Starts low, increases sharply, then plateaus at a high level.
* Data Points:
* Model 5: ~82%
* Model 6: ~85%
* Model 7: ~86%
* Model 8: ~87%
* Model 9: ~89%
* Model 10: ~89%
**4. GPQA Diamond (Dark Blue Circles):**
* Trend: Highly variable initially, then increases and plateaus.
* Data Points:
* Model 1: ~33%
* Model 2: ~40%
* Model 3: ~50%
* Model 4: ~41%
* Model 5: ~65%
* Model 6: ~68%
* Model 7: ~85%
* Model 8: ~84%
* Model 9: ~84%
* Model 10: ~82%
**5. MMLU Pro (Gray Diamonds):**
* Trend: Only two data points are available, showing an increase.
* Data Points:
* Model 4: ~65%
* Model 5: ~78%
### Key Observations
* "Big-Bench-Hard" and "MMLU" show relatively consistent high performance across the first four models.
* "GPQA Diamond" has the most variable performance, with a significant jump between models 5 and 7.
* "MMMLU" achieves high scores, plateauing after model 7.
* "MMLU Pro" only has two data points, making it difficult to assess its overall trend.
### Interpretation
The chart provides a comparative analysis of different models' performance on various benchmarks. The "GPQA Diamond" benchmark appears to be more challenging for the earlier models, as indicated by the lower scores. The "Big-Bench-Hard" and "MMLU" benchmarks seem to be more consistently handled by the models tested. The "MMMLU" benchmark shows a strong performance for the later models. The limited data for "MMLU Pro" makes it difficult to draw definitive conclusions about its performance relative to the other benchmarks. The data suggests that model architecture and training significantly impact performance on specific benchmarks.