## Line Chart: Benchmark Scores Across Model Numbers
### Overview
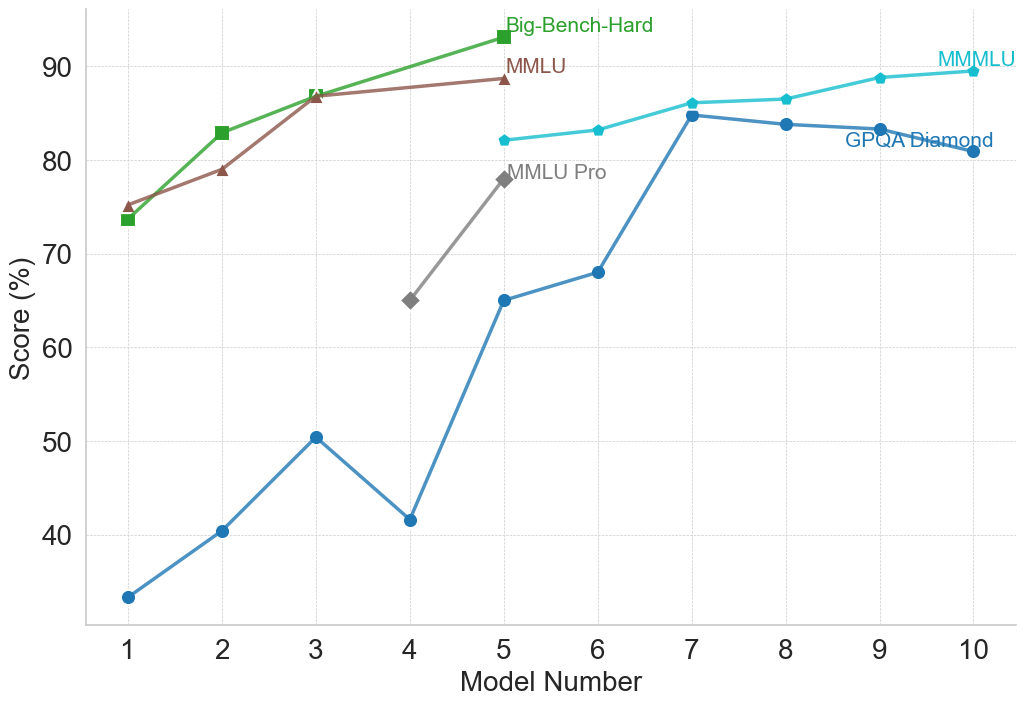
This image is a line chart displaying the performance scores (in percentages) of various models across five different evaluation benchmarks. The x-axis represents a sequential "Model Number" from 1 to 10, while the y-axis represents the "Score (%)". The chart uses inline labeling rather than a separate legend, with text placed near the end of each respective data line.
### Components/Axes
* **Y-axis (Left):** Labeled "Score (%)". The scale features major tick marks at 40, 50, 60, 70, 80, and 90. The visible range extends slightly below 40 and slightly above 90.
* **X-axis (Bottom):** Labeled "Model Number". The scale features integer tick marks from 1 to 10 inclusive.
* **Gridlines:** Faint, light gray, dashed gridlines intersect at every major tick mark on both the x and y axes.
* **Legend/Labels:** There is no standalone legend box. Labels are color-coded to match their respective lines and are placed directly adjacent to the final data point of each series.
### Detailed Analysis
**1. Big-Bench-Hard (Green line, Square markers)**
* *Spatial Grounding:* Label is located at the top-center of the chart, just to the right of the final data point at x=5.
* *Trend Verification:* The line slopes upward consistently from Model 1 to Model 5. Notably, there is no data point at Model 4; the line connects directly from Model 3 to Model 5.
* *Data Points (Approximate ±1%):*
* Model 1: ~74%
* Model 2: ~83%
* Model 3: ~87%
* Model 4: (No data point)
* Model 5: ~93%
**2. MMLU (Brown line, Triangle markers)**
* *Spatial Grounding:* Label is located at the top-center, directly below the "Big-Bench-Hard" label, adjacent to its final point at x=5.
* *Trend Verification:* The line slopes upward from Model 1 to Model 3, then the slope flattens significantly, rising only slightly to Model 5. Similar to the green line, there is no data point at Model 4.
* *Data Points (Approximate ±1%):*
* Model 1: ~75%
* Model 2: ~79%
* Model 3: ~87% (Overlaps exactly with the Big-Bench-Hard point)
* Model 4: (No data point)
* Model 5: ~89%
**3. MMLU Pro (Gray line, Diamond markers)**
* *Spatial Grounding:* Label is located in the upper-middle section, adjacent to its final point at x=5.
* *Trend Verification:* This series only contains two points, showing a steep upward slope from Model 4 to Model 5.
* *Data Points (Approximate ±1%):*
* Model 4: ~65%
* Model 5: ~78%
**4. MMMLU (Cyan/Light Blue line, Small pentagon markers)**
* *Spatial Grounding:* Label is located at the top-right of the chart, just above the final data point at x=10.
* *Trend Verification:* The line shows a gradual, consistent upward slope starting from Model 5 and ending at Model 10.
* *Data Points (Approximate ±0.5%):*
* Model 5: ~82%
* Model 6: ~83%
* Model 7: ~86%
* Model 8: ~86.5%
* Model 9: ~89%
* Model 10: ~89.5%
**5. GPQA Diamond (Dark Blue line, Circle markers)**
* *Spatial Grounding:* Label is located on the right side, positioned slightly below the line segment connecting Model 9 and Model 10.
* *Trend Verification:* This is the most volatile series. It slopes upward from Model 1 to 3, drops sharply at Model 4, rises steeply through Model 5 to peak at Model 7, and then exhibits a slight, gradual downward slope to Model 10.
* *Data Points (Approximate ±1%):*
* Model 1: ~33%
* Model 2: ~40%
* Model 3: ~50.5%
* Model 4: ~41.5%
* Model 5: ~65%
* Model 6: ~68%
* Model 7: ~85%
* Model 8: ~84%
* Model 9: ~83.5%
* Model 10: ~81%
### Key Observations
* **Data Discontinuity:** The chart is split into two distinct phases. "Big-Bench-Hard" and "MMLU" are only tracked from Models 1 to 5. "MMMLU" is only tracked from Models 5 to 10. "MMLU Pro" only exists for Models 4 and 5. Only "GPQA Diamond" spans the entire x-axis (Models 1 through 10).
* **Missing Data:** Models 1-3 and 5 have data for Big-Bench-Hard and MMLU, but Model 4 is explicitly skipped for these two metrics.
* **Convergence at Model 5:** Model 5 is the only point on the x-axis where all five benchmark series have a recorded data point, acting as a transition point in the chart.
* **Performance Ceiling:** Big-Bench-Hard reaches the highest absolute score on the chart (~93% at Model 5).
* **Anomaly:** The sharp drop in GPQA Diamond performance at Model 4 is a significant anomaly compared to the general upward trend of all other data points in the first half of the chart.
### Interpretation
This chart likely illustrates the progression of a specific family of Large Language Models (LLMs) across different training checkpoints, parameter sizes, or generational iterations (represented by "Model Number" 1 through 10).
The data suggests a narrative of benchmark saturation and evolution. The older or standard benchmarks (Big-Bench-Hard, MMLU) show high performance early on, nearing the 90%+ range by Model 5. Because these benchmarks may have "maxed out" or lost their utility for measuring further intelligence gains, they appear to have been retired after Model 5.
In their place, harder variants were introduced. "MMLU Pro" is introduced at Model 4, showing significantly lower scores than standard MMLU, proving it is a more rigorous test. By Model 5, "MMMLU" is introduced and tracked through Model 10, replacing the older benchmarks.
"GPQA Diamond" is clearly the most difficult benchmark for the early models (starting at a very low ~33%). The sharp drop at Model 4 for GPQA Diamond suggests that specific model iteration might have been optimized for different tasks, suffered from catastrophic forgetting, or was a smaller parameter model in a varied lineup. However, by Model 7, the model architecture or training seems to have "cracked" the GPQA Diamond benchmark, jumping to 85%, before plateauing and slightly degrading, which could indicate overfitting on other tasks in later models (8-10).
Overall, the chart demonstrates a clear trajectory of increasing model capability, necessitating the introduction of increasingly difficult evaluation metrics to accurately gauge performance.