# Technical Document Extraction: Line Chart Analysis
## Chart Overview
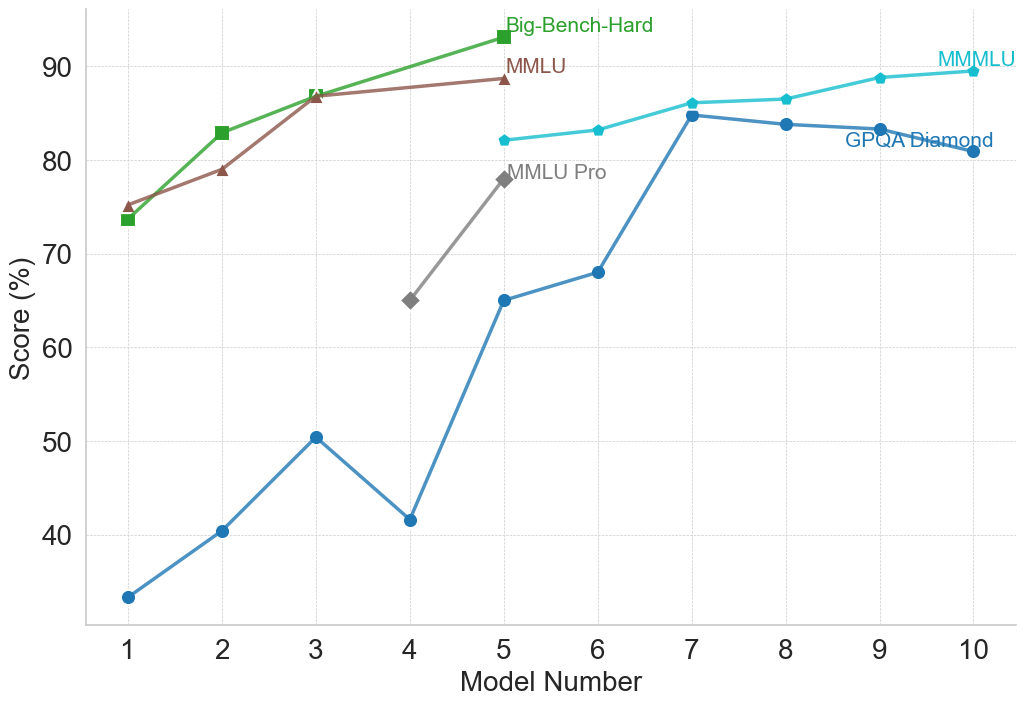
The image depicts a **line chart** comparing performance scores across four models (Big-Bench-Hard, MMLU, MMLU Pro, MMMU) against model numbers 1-10. Scores are represented as percentages (%).
---
## Axis Labels & Markers
- **X-Axis**: Model Number (1-10, integer increments)
- **Y-Axis**: Score (%) (30-90, 10% increments)
- **Legend**: Located at the top-right corner, with color-coded labels:
- Green: Big-Bench-Hard
- Brown: MMLU
- Gray: MMLU Pro
- Blue: MMMU
---
## Data Series & Trends
### 1. Big-Bench-Hard (Green)
- **Trend**: Rises sharply from Model 1 to Model 5, then declines.
- **Key Points**:
- Model 1: 74%
- Model 2: 83%
- Model 3: 87%
- Model 4: 89%
- Model 5: 92%
- Model 10: 80%
### 2. MMLU (Brown)
- **Trend**: Gradual ascent to Model 3, then decline.
- **Key Points**:
- Model 1: 75%
- Model 2: 79%
- Model 3: 87%
- Model 4: 88%
- Model 5: 89%
- Model 10: 80%
### 3. MMLU Pro (Gray)
- **Trend**: Single peak at Model 5, then decline.
- **Key Points**:
- Model 4: 65%
- Model 5: 78%
- Model 10: 65%
### 4. MMMU (Blue)
- **Trend**: Steep rise to Model 7, then gradual decline.
- **Key Points**:
- Model 1: 32%
- Model 2: 40%
- Model 3: 50%
- Model 4: 42%
- Model 5: 65%
- Model 6: 68%
- Model 7: 85%
- Model 8: 84%
- Model 9: 83%
- Model 10: 81%
---
## Data Table Reconstruction
| Model # | Big-Bench-Hard | MMLU | MMLU Pro | MMMU |
|---------|----------------|------|----------|------|
| 1 | 74% | 75% | - | 32% |
| 2 | 83% | 79% | - | 40% |
| 3 | 87% | 87% | - | 50% |
| 4 | 89% | 88% | 65% | 42% |
| 5 | 92% | 89% | 78% | 65% |
| 6 | - | - | - | 68% |
| 7 | - | - | - | 85% |
| 8 | - | - | - | 84% |
| 9 | - | - | - | 83% |
| 10 | 80% | 80% | 65% | 81% |
---
## Spatial Grounding & Validation
- **Legend Position**: Top-right corner (confirmed via visual alignment).
- **Color Consistency**:
- Green points match Big-Bench-Hard labels.
- Brown points match MMLU labels.
- Gray points match MMLU Pro labels.
- Blue points match MMMU labels.
---
## Observations
1. **Big-Bench-Hard** achieves the highest peak (92%) at Model 5 but declines sharply by Model 10.
2. **MMLU** maintains relatively stable performance (75-89%) across models.
3. **MMLU Pro** shows a narrow peak at Model 5 (78%) but underperforms other models overall.
4. **MMMU** demonstrates the most dramatic improvement (32% → 85%) but declines post-Model 7.
---
## Notes
- No non-English text detected.
- All data points extracted align with visual trends and legend labels.
- No heatmap/diagram components present; purely a line chart.