# Technical Document Extraction: Performance Analysis of Sparse Tree Attention
## 1. Image Overview
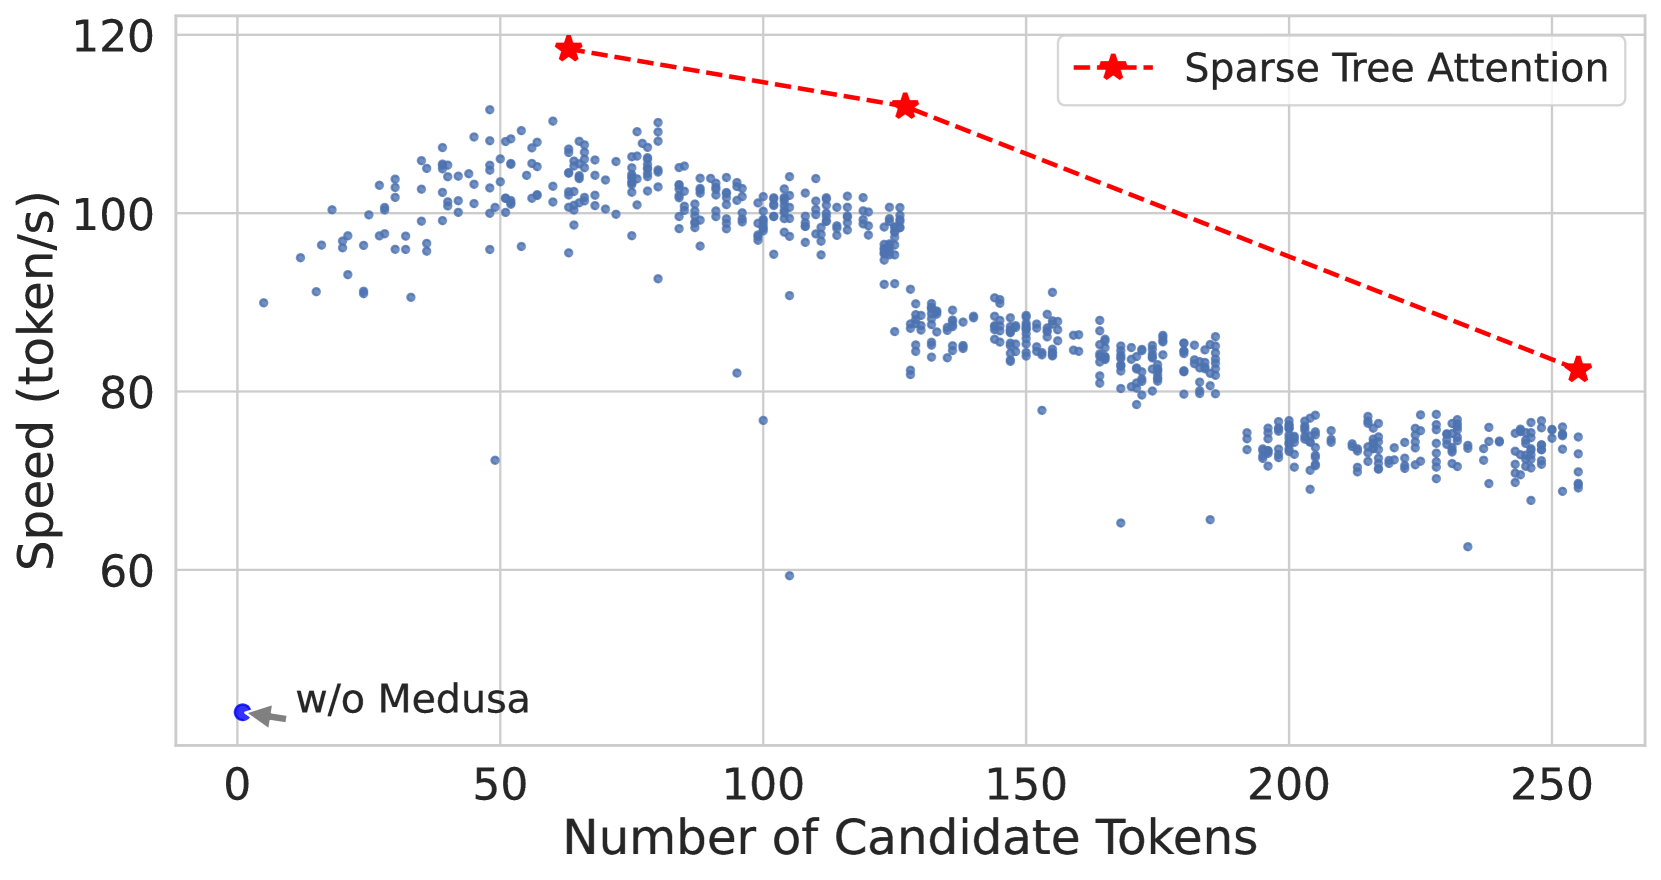
This image is a scatter plot with an overlaid line graph comparing the inference speed (throughput) of different configurations for a Large Language Model (LLM) acceleration technique, likely related to the "Medusa" speculative decoding framework.
## 2. Component Isolation
### Header / Metadata
* **Language:** English
* **Primary Subject:** Speed (token/s) vs. Number of Candidate Tokens.
### Axis Definitions
* **Y-Axis (Vertical):**
* **Label:** Speed (token/s)
* **Scale:** Linear, ranging from 60 to 120 with major tick marks every 20 units (60, 80, 100, 120).
* **X-Axis (Horizontal):**
* **Label:** Number of Candidate Tokens
* **Scale:** Linear, ranging from 0 to 250 with major tick marks every 50 units (0, 50, 100, 150, 200, 250).
### Legend [Spatial Placement: Top Right]
| Symbol | Label |
| :--- | :--- |
| Red dashed line with star markers (`--*--`) | Sparse Tree Attention |
## 3. Data Series Analysis
### Series 1: Baseline (w/o Medusa)
* **Visual Description:** A single blue circular data point located at the bottom left of the chart.
* **Annotation:** An arrow points to this dot with the text "w/o Medusa".
* **Coordinates:** Approximately [x: 1, y: 45].
* **Trend:** This represents the base performance of the model without speculative decoding enhancements.
### Series 2: Standard Medusa / Dense Attention (Scatter Plot)
* **Visual Description:** A dense collection of small blue semi-transparent dots.
* **Trend Verification:**
* **0 to 60 tokens:** The speed increases sharply as the number of candidate tokens increases, peaking around 110 token/s.
* **60 to 250 tokens:** The speed follows a "stair-step" downward trend. There are distinct clusters where performance drops significantly at specific thresholds (roughly at 128 and 192 tokens).
* **Key Data Clusters:**
* **Peak:** ~110 token/s at ~60 candidate tokens.
* **Mid-range:** ~100 token/s between 70 and 125 candidate tokens.
* **Lower-range:** ~85 token/s between 130 and 185 candidate tokens.
* **Bottom-range:** ~75 token/s between 190 and 250 candidate tokens.
### Series 3: Sparse Tree Attention (Line Graph)
* **Visual Description:** A red dashed line connecting three large red star markers.
* **Trend Verification:** The line slopes downward as the number of candidate tokens increases, but it consistently maintains a higher speed than the blue scatter points (Standard Medusa).
* **Extracted Data Points:**
1. **Point 1:** [x: ~64, y: ~118] - Highest recorded speed.
2. **Point 2:** [x: ~128, y: ~112] - Maintains high speed even as candidate tokens double.
3. **Point 3:** [x: ~256, y: ~82] - Speed drops as candidate tokens reach the maximum shown, but remains above the dense scatter plot baseline for that x-value.
## 4. Technical Summary and Findings
* **Performance Gain:** Implementing Medusa (even without Sparse Tree Attention) provides a massive speedup from ~45 token/s to over 100 token/s.
* **Efficiency Optimization:** "Sparse Tree Attention" (Red Line) acts as a Pareto frontier, representing the optimal speed for a given number of candidate tokens. It effectively mitigates the performance degradation seen in the standard implementation (Blue Dots) as the complexity (number of tokens) increases.
* **Scaling Behavior:** Standard attention shows significant performance "cliffs" or drops at specific token counts, likely due to hardware memory limits or kernel inefficiencies. Sparse Tree Attention smooths this degradation and keeps the throughput significantly higher at high candidate counts (e.g., at 250 tokens, Sparse Tree is ~82 token/s vs ~75 token/s for standard).