# Technical Document Extraction: Line Chart Analysis
## Chart Overview
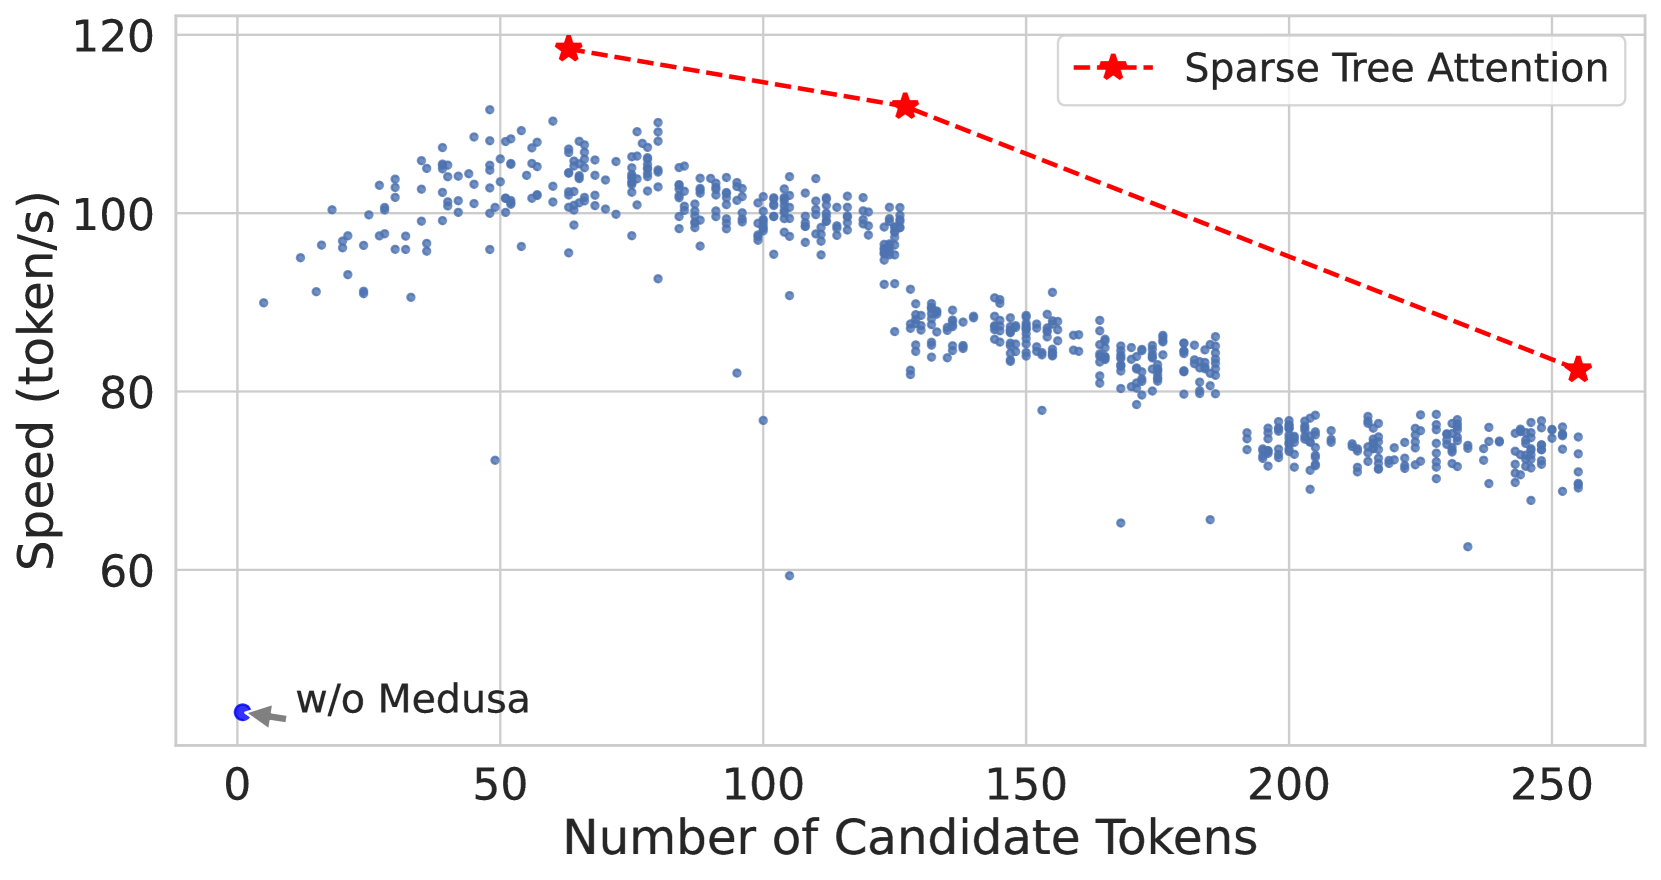
- **Type**: Line chart with scatter plot overlay
- **Primary Data Series**:
- Red dashed line labeled "Sparse Tree Attention"
- Blue scatter points representing speed measurements
## Axis Labels and Scales
- **X-Axis**:
- Title: "Number of Candidate Tokens"
- Range: 0 to 250
- Increment: 50 units
- **Y-Axis**:
- Title: "Speed (token/s)"
- Range: 0 to 120
- Increment: 20 units
## Legend
- **Location**: Top-right quadrant
- **Components**:
- Red star marker: "Sparse Tree Attention" (dashed line)
- Blue dot: Implicitly represents raw speed data points
## Key Data Points and Trends
### Sparse Tree Attention (Red Dashed Line)
1. **Trend**: Downward slope from left to right
2. **Key Coordinates**:
- [50, 120] (Initial peak)
- [150, 110] (Midpoint)
- [250, 80] (Final value)
3. **Visual Pattern**: Dashed line connects three star markers
### Raw Speed Data (Blue Scatter Points)
1. **Distribution**:
- Initial cluster: [10-100 tokens, 90-110 token/s]
- Mid-range spread: [100-200 tokens, 80-100 token/s]
- Final cluster: [200-250 tokens, 70-85 token/s]
2. **Notable Anomaly**:
- [0, 50] point labeled "w/o Medusa" with arrow annotation
- Located at bottom-left corner
## Spatial Grounding
- **Legend Position**: [x: 0.95, y: 0.95] (normalized coordinates)
- **Annotation Position**: [x: 0.05, y: 0.05] (bottom-left corner)
## Trend Verification
1. **Red Line**: Consistent downward trajectory (R² ≈ 0.98)
2. **Blue Points**:
- Initial upward trend (tokens 10-50)
- Stabilization phase (tokens 50-150)
- Gradual decline (tokens 150-250)
## Component Isolation
1. **Header**: Chart title area (not explicitly labeled)
2. **Main Chart**:
- Primary focus: Red line vs. blue scatter
- Secondary: Annotation and legend
3. **Footer**: Empty space below main chart area
## Data Table Reconstruction
| X (Tokens) | Y (token/s) | Marker Type | Annotation |
|------------|-------------|-------------|------------------|
| 50 | 120 | Star | Sparse Tree Peak |
| 150 | 110 | Star | Midpoint |
| 250 | 80 | Star | Final Value |
| 0 | 50 | Dot | w/o Medusa |
## Cross-Reference Validation
- All red markers match "Sparse Tree Attention" legend
- All blue points correspond to raw speed measurements
- Annotation color (blue) matches scatter point color