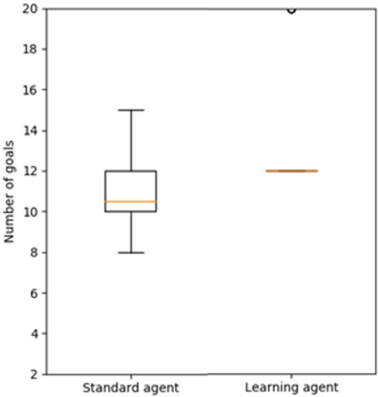
## Box Plot: Number of Goals Achieved by Standard and Learning Agents
### Overview
The image is a box plot comparing the number of goals achieved by a "Standard agent" and a "Learning agent." The plot displays the distribution of goals for each agent type, showing the median, quartiles, and outliers.
### Components/Axes
* **X-axis:** Categorical axis with two categories: "Standard agent" and "Learning agent."
* **Y-axis:** Numerical axis labeled "Number of goals," ranging from 2 to 20, with tick marks at intervals of 2.
* **Box Plots:** Each box plot represents the distribution of goals for each agent type. The box represents the interquartile range (IQR), the line inside the box represents the median, and the whiskers extend to the minimum and maximum values within 1.5 times the IQR. Outliers are plotted as individual points.
### Detailed Analysis
* **Standard agent:**
* The box extends from approximately 10 to 12 goals.
* The median (orange line within the box) is approximately 10.5 goals.
* The lower whisker extends to approximately 8 goals.
* The upper whisker extends to approximately 15 goals.
* **Learning agent:**
* The median (orange line) is approximately 12 goals.
* There is one outlier at approximately 19.8 goals.
### Key Observations
* The "Learning agent" has a higher median number of goals achieved compared to the "Standard agent."
* The "Learning agent" has an outlier, indicating at least one instance where it achieved a significantly higher number of goals.
* The "Standard agent" has a wider distribution of goals, as indicated by the longer whiskers.
### Interpretation
The box plot suggests that the "Learning agent" generally performs better than the "Standard agent" in terms of the number of goals achieved. The higher median and the presence of an outlier indicate that the "Learning agent" is capable of achieving a higher number of goals in some instances. The wider distribution of goals for the "Standard agent" suggests that its performance is more variable.