## Chart Type: Box Plot of Agent Performance (Number of Goals)
### Overview
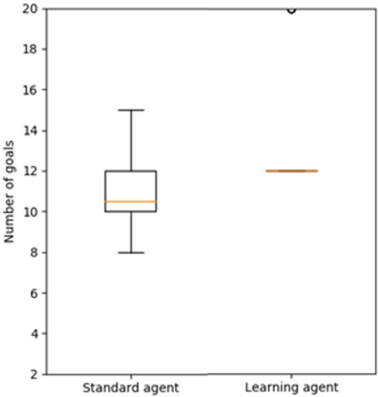
The image displays a box plot comparing the "Number of goals" achieved by two different types of agents: "Standard agent" and "Learning agent." The chart provides a statistical summary of the distribution of goals for each agent type, including median, interquartile range (IQR), whiskers, and outliers.
### Components/Axes
The chart is a 2D plot with a vertical Y-axis and a horizontal X-axis.
* **Y-axis Label**: "Number of goals"
* **Y-axis Scale**: Ranges from 2 to 20. Major tick marks are present at 2, 4, 6, 8, 10, 12, 14, 16, 18, and 20.
* **X-axis Label**: Not explicitly labeled, but the categories represent different agent types.
* **X-axis Categories**:
* "Standard agent" (positioned on the left)
* "Learning agent" (positioned on the right)
* **Legend**: No explicit legend is present. The X-axis categories serve as labels for the two box plots.
### Detailed Analysis
The chart presents two box plots, each representing the distribution of "Number of goals" for a specific agent type.
1. **Standard agent (left box plot)**:
* **Visual Trend/Distribution**: This box plot shows a distribution of goals ranging from approximately 8 to 15, with a central tendency around 10-11. The box is relatively wide, indicating variability in performance.
* **Median (orange line inside the box)**: Approximately 10.5 goals.
* **First Quartile (Q1, bottom of the box)**: Approximately 10 goals. This means 25% of the standard agent's performances were at or below 10 goals.
* **Third Quartile (Q3, top of the box)**: Approximately 12 goals. This means 75% of the standard agent's performances were at or below 12 goals.
* **Interquartile Range (IQR)**: Q3 - Q1 = 12 - 10 = 2 goals. The middle 50% of performances fall within this range.
* **Lower Whisker (bottom T-bar)**: Approximately 8 goals. This represents the minimum value within 1.5 times the IQR from Q1.
* **Upper Whisker (top T-bar)**: Approximately 15 goals. This represents the maximum value within 1.5 times the IQR from Q3.
* **Outliers**: No outliers are visible for the Standard agent.
2. **Learning agent (right box plot)**:
* **Visual Trend/Distribution**: This box plot is highly compressed, appearing as a single horizontal line for the box and whiskers, indicating very low variability for the majority of its performances. There is one distinct outlier at a much higher value.
* **Median (orange line inside the box)**: Approximately 12 goals.
* **First Quartile (Q1, bottom of the box)**: Approximately 12 goals.
* **Third Quartile (Q3, top of the box)**: Approximately 12 goals.
* **Interquartile Range (IQR)**: Q3 - Q1 = 12 - 12 = 0 goals. This indicates that at least 50% of the learning agent's performances (from Q1 to Q3) resulted in exactly 12 goals.
* **Lower Whisker (bottom T-bar)**: Approximately 12 goals.
* **Upper Whisker (top T-bar)**: Approximately 12 goals. The fact that the whiskers are also at 12 goals suggests that all non-outlier data points for the learning agent are exactly 12 goals.
* **Outliers (black circle)**: One outlier is visible at approximately 20 goals, positioned near the top of the chart. This indicates an exceptionally high performance compared to the agent's typical results.
### Key Observations
* The "Learning agent" shows significantly less variability in its typical performance (IQR of 0) compared to the "Standard agent" (IQR of 2).
* The median performance of the "Learning agent" (12 goals) is higher than that of the "Standard agent" (10.5 goals).
* The "Learning agent" achieved a maximum performance (outlier) of approximately 20 goals, which is considerably higher than any performance observed for the "Standard agent" (max 15 goals).
* The "Standard agent" has a wider range of typical outcomes (from 8 to 15 goals) than the "Learning agent" (which consistently achieves 12 goals, excluding the outlier).
### Interpretation
The data suggests that the "Learning agent" generally performs better and more consistently than the "Standard agent.
* **Consistency**: The "Learning agent" demonstrates remarkable consistency, achieving exactly 12 goals in the vast majority of its trials (indicated by the zero IQR and whiskers at 12). This implies a robust and predictable performance for its typical operation.
* **Higher Typical Performance**: The "Learning agent's" median performance of 12 goals is higher than the "Standard agent's" median of 10.5 goals, indicating a generally superior baseline.
* **Exceptional Potential**: The presence of an outlier at 20 goals for the "Learning agent" highlights its potential for exceptionally high performance, surpassing the maximum observed for the "Standard agent" by a significant margin (20 vs. 15 goals). This could suggest that under certain conditions or with further optimization, the learning agent can achieve peak results far beyond its typical output.
* **Variability**: The "Standard agent" exhibits more variability in its performance, with goals ranging from 8 to 15. While its upper whisker reaches 15 goals, its median is lower, and its lower whisker is at 8 goals, indicating a broader spread of outcomes, some of which are quite low.
In summary, the "Learning agent" appears to be a more effective and reliable performer, consistently achieving a higher number of goals, and also demonstrating the capacity for outstanding, albeit less frequent, peak performances. The "Standard agent" is less consistent and generally achieves fewer goals.