\n
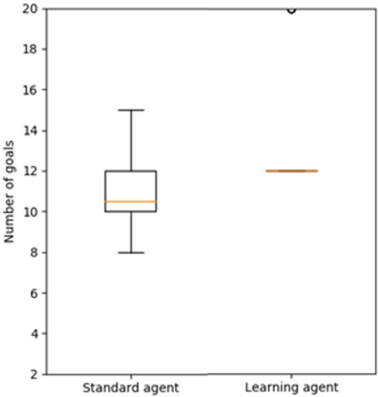
## Chart: Box Plot Comparison of Goal Achievement
### Overview
The image presents a comparative box plot illustrating the distribution of the number of goals achieved by two types of agents: a "Standard agent" and a "Learning agent". The plot displays the median, quartiles, and potential outliers for each agent type.
### Components/Axes
* **X-axis:** Categorical, labeled "Standard agent" and "Learning agent".
* **Y-axis:** Numerical, labeled "Number of goals", with a scale ranging from 2 to 20, incrementing by 2.
* **Box Plots:** Two box plots are displayed, one for each agent type. Each box plot includes:
* A box representing the interquartile range (IQR).
* A horizontal line within the box representing the median.
* "Whiskers" extending from the box, indicating the range of the data (excluding outliers).
* Outliers represented as individual points.
### Detailed Analysis
**Standard Agent:**
* The box plot for the Standard agent is positioned on the left side of the chart.
* The median value appears to be approximately 11.
* The bottom of the box (Q1) is around 8.
* The top of the box (Q3) is around 12.
* The whiskers extend down to approximately 8 and up to approximately 15.
* There is one outlier at approximately 19.
**Learning Agent:**
* The box plot for the Learning agent is positioned on the right side of the chart.
* The median value appears to be approximately 12.
* The bottom of the box (Q1) is around 11.
* The top of the box (Q3) is around 13.
* The whiskers extend down to approximately 11 and up to approximately 13.
* There are no outliers visible for the Learning agent.
### Key Observations
* The Learning agent exhibits a tighter distribution of goal achievement compared to the Standard agent, as indicated by the smaller IQR.
* The median number of goals achieved by the Learning agent is slightly higher than that of the Standard agent.
* The Standard agent has a single outlier with a significantly higher number of goals achieved than the rest of the data.
* The range of the Learning agent is smaller than the Standard agent.
### Interpretation
The data suggests that the Learning agent demonstrates more consistent performance in achieving goals compared to the Standard agent. While the median goal achievement is only slightly higher for the Learning agent, the narrower distribution indicates less variability in its performance. The outlier in the Standard agent's data suggests that, in some instances, it can achieve a significantly higher number of goals, but this is not typical. The absence of outliers for the Learning agent further supports the idea of more stable and predictable performance. This could indicate that the learning algorithm is effective in optimizing goal achievement, leading to more consistent results. The difference in IQR suggests the learning agent is less susceptible to random fluctuations or external factors that might affect goal attainment.