## Box Plot: Number of Goals by Agent Type
### Overview
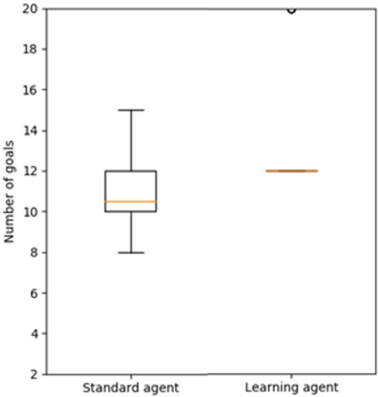
The image is a box plot comparing the distribution of the "Number of goals" achieved by two types of agents: a "Standard agent" and a "Learning agent." The chart is presented on a white background with black axes and labels.
### Components/Axes
* **Chart Type:** Box plot (also known as a box-and-whisker plot).
* **Y-Axis:**
* **Label:** "Number of goals"
* **Scale:** Linear, ranging from 2 to 20.
* **Major Tick Marks:** At intervals of 2 (2, 4, 6, 8, 10, 12, 14, 16, 18, 20).
* **X-Axis:**
* **Categories:** Two discrete categories labeled directly below their respective plots.
* **Labels (from left to right):** "Standard agent", "Learning agent".
* **Legend:** There is no separate legend box. The categories are identified by their labels on the x-axis.
* **Visual Elements:**
* **Standard agent box plot:** A rectangular box with whiskers and an outlier point.
* **Learning agent box plot:** A single horizontal line, indicating a very narrow or zero interquartile range.
### Detailed Analysis
**1. Standard Agent (Left Plot):**
* **Visual Trend:** Shows a wide distribution with a central box and extended whiskers.
* **Data Points (Approximate):**
* **Minimum (end of lower whisker):** ~8
* **First Quartile (Q1, bottom of box):** ~10
* **Median (orange line inside box):** ~10.5
* **Third Quartile (Q3, top of box):** ~12
* **Maximum (end of upper whisker):** ~15
* **Outlier (black circle):** A single data point at ~20, located in the top-right corner of the plot area, far above the upper whisker.
**2. Learning Agent (Right Plot):**
* **Visual Trend:** Shows no visible box or whiskers, represented only by a single horizontal line.
* **Data Points (Approximate):**
* The single orange line is positioned at **12** on the y-axis.
* This indicates that for the Learning agent, the median, quartiles, and likely all observed data points are concentrated at or extremely close to the value of 12. The interquartile range (IQR) is effectively zero.
### Key Observations
1. **Distribution Contrast:** The Standard agent exhibits significant variability in performance (IQR of ~2, range of ~7 plus an outlier), while the Learning agent shows perfect or near-perfect consistency at a value of 12.
2. **Central Tendency:** The median for the Standard agent (~10.5) is lower than the consistent value of the Learning agent (12).
3. **Outlier:** The Standard agent has one extreme outlier at 20 goals, which is the highest value on the chart and significantly above its own upper whisker.
4. **Spatial Layout:** The two plots are centered above their respective x-axis labels. The outlier for the Standard agent is positioned in the upper right quadrant of the chart area.
### Interpretation
This chart suggests a fundamental difference in performance characteristics between the two agent types.
* The **Learning agent** demonstrates **high reliability and predictability**, consistently achieving exactly 12 goals. This could indicate a system that has converged on a stable, optimal policy or one that is constrained to a specific outcome.
* The **Standard agent** shows **variable performance**. Its typical output (the box) is lower than the Learning agent's consistent output, but it has a wider range of results. The presence of a high outlier at 20 indicates that while less consistent, it is *capable* of achieving a much higher number of goals than the Learning agent in some instances.
* **The trade-off illustrated is between consistency and peak potential.** The Learning agent is dependable but capped. The Standard agent is less reliable and typically less effective, but possesses the potential for exceptional performance. The data implies that the "learning" mechanism may stabilize performance around a local optimum (12) but could prevent the exploration that leads to the higher outlier seen in the standard approach.