## Heatmap: Share of Target's Incoming Influence (%)
### Overview
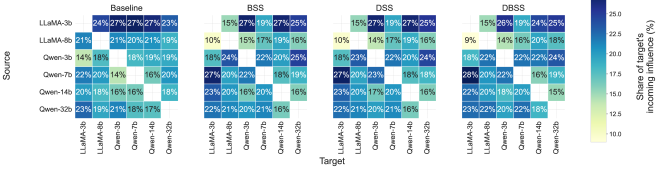
The image is a comparative heatmap analyzing the influence of different source models (y-axis) on target models (x-axis) across four evaluation metrics: Baseline, BSS, DSS, and DBSS. Each cell represents the percentage share of a target model's incoming influence attributed to a specific source model.
### Components/Axes
- **Y-Axis (Source Models)**:
- LLaMA-3b, LLaMA-8b, Qwen-3b, Qwen-7b, Qwen-14b, Qwen-32b
- **X-Axis (Target Models)**:
- LLaMA-3b, LLaMA-8b, Qwen-3b, Qwen-7b, Qwen-14b, Qwen-32b
- **Legend**:
- Color gradient from light yellow (10%) to dark blue (25%), labeled "Share of target's incoming influence (%)".
- **Quadrants**:
- Baseline (top-left), BSS (top-right), DSS (bottom-left), DBSS (bottom-right).
### Detailed Analysis
#### Baseline Metric
- **LLaMA-3b**:
- Highest influence on LLaMA-8b (27%), Qwen-3b (27%), and Qwen-7b (27%).
- Self-influence: 24%.
- **LLaMA-8b**:
- Dominates Qwen-3b (21%), Qwen-7b (20%), and Qwen-14b (19%).
- **Qwen Models**:
- Qwen-32b shows strong self-influence (23%) and impact on Qwen-14b (17%).
#### BSS Metric
- **LLaMA-3b**:
- Reduced influence on Qwen-3b (15%) and Qwen-7b (19%).
- Self-influence: 27%.
- **LLaMA-8b**:
- Lower self-influence (10%) but higher impact on Qwen-3b (17%) and Qwen-7b (19%).
- **Qwen Models**:
- Qwen-32b has elevated self-influence (22%) and impact on Qwen-14b (21%).
#### DSS Metric
- **LLaMA-3b**:
- Self-influence: 27%.
- Strong impact on Qwen-3b (22%) and Qwen-7b (23%).
- **LLaMA-8b**:
- Reduced self-influence (14%) but notable impact on Qwen-3b (20%) and Qwen-7b (23%).
- **Qwen Models**:
- Qwen-32b shows high self-influence (22%) and impact on Qwen-14b (21%).
#### DBSS Metric
- **LLaMA-3b**:
- Self-influence: 26%.
- Dominates Qwen-3b (24%) and Qwen-7b (25%).
- **LLaMA-8b**:
- Lower self-influence (14%) but strong impact on Qwen-3b (22%) and Qwen-7b (24%).
- **Qwen Models**:
- Qwen-32b has high self-influence (22%) and impact on Qwen-14b (21%).
### Key Observations
1. **Baseline Dominance**:
- LLaMA models consistently show the highest influence across all targets, especially in Baseline and DBSS metrics.
2. **BSS Reductions**:
- BSS metric reduces influence percentages for LLaMA-8b (10% self-influence) and Qwen-14b (16% self-influence).
3. **DSS/DBSS Consistency**:
- Qwen-32b maintains high self-influence (22–23%) across DSS and DBSS, suggesting robustness in adjusted metrics.
4. **Cross-Metric Variability**:
- LLaMA-8b’s influence drops significantly in BSS (10%) but rebounds in DSS/DBSS (14–16%).
### Interpretation
- **Model Robustness**:
- LLaMA models exhibit consistent high influence across metrics, indicating robustness in diverse evaluation frameworks.
- **Qwen Performance**:
- Larger Qwen models (14b, 32b) show competitive influence, particularly in DSS/DBSS, suggesting effectiveness in adjusted scenarios.
- **Metric Impact**:
- BSS reduces influence percentages for smaller models (e.g., LLaMA-8b), while DSS/DBSS amplify Qwen-32b’s self-influence.
- **Anomalies**:
- Qwen-14b’s low self-influence (16% in BSS) contrasts with its higher impact on other models (20% in DSS), highlighting metric-dependent behavior.
The data underscores how evaluation metrics differentially affect perceived influence, with LLaMA models maintaining dominance and Qwen models showing metric-specific strengths.