## Diagrams: Causal Diagram and Ternary Plot
### Overview
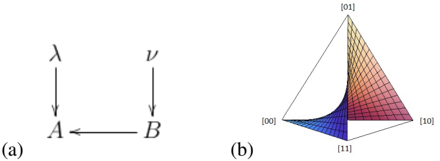
The image presents two diagrams side-by-side. Diagram (a) depicts a causal relationship between variables using arrows. Diagram (b) is a ternary plot representing a function over three variables.
### Components/Axes
**Diagram (a): Causal Diagram**
* Nodes: Labeled as A and B.
* Variables: λ (lambda) and ν (nu).
* Arrows:
* λ points to A.
* ν points to B.
* B points to A.
**Diagram (b): Ternary Plot**
* Vertices: Labeled as [00], [01], [10], and [11]. These likely represent the corners of a tetrahedron.
* Surface: A curved surface is plotted within the tetrahedron, colored from blue to red. The blue region is near the [11] vertex, and the red region is near the [01] and [10] vertices.
### Detailed Analysis
**Diagram (a): Causal Diagram**
* The diagram shows that variable λ influences A, variable ν influences B, and B influences A. This suggests a feedback loop or interaction between A and B.
**Diagram (b): Ternary Plot**
* The surface represents a function whose value varies depending on the relative proportions of the components represented by the vertices.
* The color gradient indicates the value of the function, with blue representing lower values and red representing higher values.
* The surface is relatively flat near the [01] and [10] vertices, indicating that the function is less sensitive to changes in the proportions of these components in this region.
* The surface curves sharply near the [11] vertex, indicating that the function is highly sensitive to changes in the proportion of this component in this region.
### Key Observations
* Diagram (a) shows a simple causal network.
* Diagram (b) visualizes a function over a three-dimensional space.
### Interpretation
The diagrams likely represent a system where two variables, A and B, influence each other, with external factors λ and ν also playing a role. The ternary plot visualizes a function that depends on the state of a system with four possible states, [00], [01], [10], and [11]. The shape of the surface indicates how the function's value changes as the relative proportions of these states vary. The sharp curvature near [11] suggests that this state has a significant impact on the function's value.