## Diagram: Bidirectional Relationship and 3D Geometric Structure
### Overview
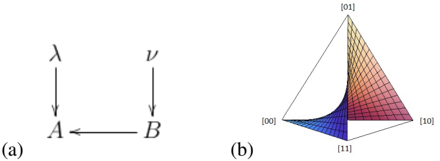
The image contains two distinct components:
1. **Part (a)**: A bidirectional relationship diagram with labeled arrows and nodes.
2. **Part (b)**: A 3D pyramid-like structure with labeled edges and color gradients.
### Components/Axes
#### Part (a): Bidirectional Relationship
- **Nodes**:
- `A` (left) and `B` (right), connected by a horizontal bidirectional arrow.
- **Arrows**:
- Vertical arrows labeled `λ` (from `A` to `B`) and `ν` (from `B` to `A`).
- **Interpretation**:
- Represents a transformation or mapping between `A` and `B`, with `λ` and `ν` as directional operators or functions.
#### Part (b): 3D Geometric Structure
- **Structure**:
- A tetrahedral pyramid with triangular faces.
- Base edges labeled `[00]`, `[10]`, `[11]`.
- Apex labeled `[01]`.
- **Color Gradient**:
- Blue (base) to red (apex), suggesting a scalar parameter (e.g., intensity, probability, or value).
- **Labels**:
- Binary-like labels (`[00]`, `[01]`, `[10]`, `[11]`) on edges, possibly representing coordinates, states, or binary vectors.
### Detailed Analysis
#### Part (a):
- No numerical values or scales provided.
- Arrows imply a reversible relationship between `A` and `B`, mediated by `λ` and `ν`.
#### Part (b):
- **Edge Labels**:
- `[00]`: Base-left edge.
- `[10]`: Base-right edge.
- `[11]`: Base-center edge.
- `[01]`: Apex.
- **Color Gradient**:
- Blue (low value) to red (high value), but no explicit legend or scale.
- **Geometry**:
- Symmetric triangular base with apex offset, forming a tetrahedron.
### Key Observations
1. **Part (a)**:
- The bidirectional arrow between `A` and `B` suggests mutual dependency or equivalence.
- `λ` and `ν` may represent distinct transformations (e.g., linear operators, logical implications).
2. **Part (b)**:
- Binary labels (`[00]`, `[01]`, etc.) resemble binary coordinates or state representations.
- Color gradient implies a scalar field, but no quantitative data is provided.
- The apex (`[01]`) is distinct from the base, possibly indicating a hierarchical or prioritized structure.
### Interpretation
- **Part (a)**:
- Likely represents a mathematical or logical system where `A` and `B` are interrelated through transformations `λ` and `ν`. This could model processes like data flow, function composition, or state transitions.
- **Part (b)**:
- The 3D structure may visualize a geometric or computational concept, such as:
- A probability simplex (if colors represent probabilities).
- A binary decision tree or state machine (with `[00]`, `[01]`, etc., as states).
- A coordinate system in a 3D space with binary or ternary logic.
- The absence of a legend for the color gradient limits quantitative interpretation.
### Notable Patterns
- **Part (a)**: Symmetry in the bidirectional relationship suggests equivalence or duality.
- **Part (b)**: The apex (`[01]`) is isolated from the base, potentially signifying a unique or dominant state.
### Conclusion
The diagrams collectively imply a system with bidirectional interactions (Part a) and a hierarchical or geometric structure (Part b). The binary labels and color gradient hint at computational or mathematical modeling, but further context is required for precise interpretation.