## Density Plot: Difference in Reasoning Chain Lengths
### Overview
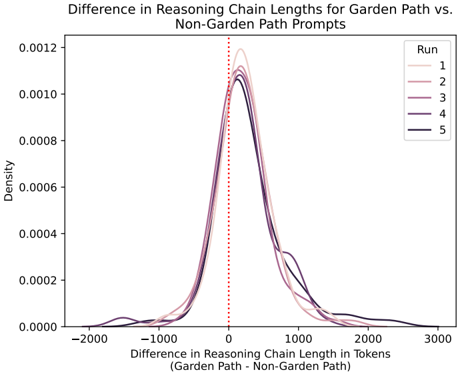
The image is a density plot comparing the difference in reasoning chain lengths (in tokens) between "Garden Path" and "Non-Garden Path" prompts. The plot shows the distribution of these differences across five runs, with each run represented by a different colored line. A vertical dotted red line is placed at x=0.
### Components/Axes
* **Title:** Difference in Reasoning Chain Lengths for Garden Path vs. Non-Garden Path Prompts
* **X-axis:** Difference in Reasoning Chain Length in Tokens (Garden Path - Non-Garden Path)
* Scale ranges from -2000 to 3000, with tick marks at -2000, -1000, 0, 1000, 2000, and 3000.
* **Y-axis:** Density
* Scale ranges from 0.0000 to 0.0012, with tick marks at 0.0000, 0.0002, 0.0004, 0.0006, 0.0008, 0.0010, and 0.0012.
* **Legend (top-right):**
* Run 1 (light pink)
* Run 2 (pink)
* Run 3 (purple)
* Run 4 (dark purple)
* Run 5 (black)
* **Vertical Line:** A dotted red line at x=0.
### Detailed Analysis
The plot displays five density curves, each representing a different run. All curves are centered near x=0, indicating that, on average, the reasoning chain lengths for Garden Path and Non-Garden Path prompts are similar. However, there is variation across runs and a spread in the differences.
* **Run 1 (light pink):** The curve peaks around x=0 and has a wider spread compared to other runs, extending further into both negative and positive values.
* **Run 2 (pink):** Similar to Run 1, but the peak is slightly more pronounced and the spread is somewhat narrower.
* **Run 3 (purple):** The curve is more concentrated around x=0 compared to Runs 1 and 2.
* **Run 4 (dark purple):** Very similar to Run 3, with a slightly narrower spread.
* **Run 5 (black):** The curve is the most concentrated around x=0, indicating the smallest difference in reasoning chain lengths between the two prompt types for this run.
All runs show a positive skew, with a longer tail extending towards positive values on the x-axis. This suggests that, when there is a difference, the Garden Path prompts tend to result in slightly longer reasoning chains than the Non-Garden Path prompts.
### Key Observations
* The distributions are centered around zero, suggesting that, on average, there is no significant difference in reasoning chain lengths between Garden Path and Non-Garden Path prompts.
* There is variability across runs, indicating that the difference in reasoning chain lengths can vary depending on the specific run.
* The positive skew suggests that Garden Path prompts are more likely to result in slightly longer reasoning chains than Non-Garden Path prompts.
* Run 5 (black) shows the most consistent results, with the smallest difference in reasoning chain lengths.
### Interpretation
The density plot suggests that, while there is some variability, the reasoning chain lengths for Garden Path and Non-Garden Path prompts are generally similar. The slight positive skew indicates a tendency for Garden Path prompts to result in slightly longer reasoning chains, but this effect is not consistent across all runs. The vertical line at x=0 serves as a visual reference, highlighting the central tendency of the distributions. The differences between runs could be due to variations in the specific prompts used, the model's state, or other random factors. The data suggests that the "garden path" effect, if present, does not consistently lead to substantially longer reasoning chains.