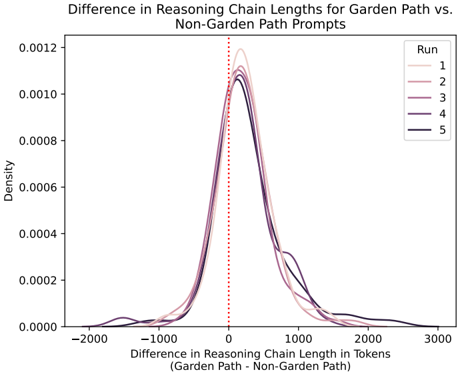
## Line Chart: Difference in Reasoning Chain Lengths for Garden Path vs. Non-Garden Path Prompts
### Overview
The chart visualizes the distribution of differences in reasoning chain lengths (in tokens) between Garden Path and Non-Garden Path prompts across five experimental runs. Each line represents a density curve for a specific run, with the x-axis showing the difference in token counts and the y-axis representing density. A red dotted vertical line at x=0 serves as a reference point for zero difference.
### Components/Axes
- **X-Axis**: "Difference in Reasoning Chain Length in Tokens (Garden Path - Non-Garden Path)"
- Range: -2000 to 3000 tokens
- Key marker: Red dotted line at x=0 (zero difference).
- **Y-Axis**: "Density" (scale: 0.0000 to 0.0012).
- **Legend**: Located in the top-right corner, listing five runs (Run 1 to Run 5) with corresponding colors:
- Run 1: Light pink
- Run 2: Medium pink
- Run 3: Purple
- Run 4: Dark purple
- Run 5: Black
### Detailed Analysis
1. **Run 1 (Light Pink)**:
- Peaks at approximately x=-500 with a density of ~0.0011.
- Broadest distribution, spanning from ~-1500 to ~1000 tokens.
- Slightly skewed left (more negative differences).
2. **Run 2 (Medium Pink)**:
- Peaks near x=-300 with a density of ~0.0010.
- Narrower than Run 1, spanning ~-1200 to ~800 tokens.
- More symmetric than Run 1.
3. **Run 3 (Purple)**:
- Peaks at x=-200 with a density of ~0.0009.
- Moderate spread (~-1000 to ~600 tokens).
- Slightly skewed right compared to Runs 1-2.
4. **Run 4 (Dark Purple)**:
- Peaks near x=-100 with a density of ~0.0008.
- Narrowest distribution (~-800 to ~400 tokens).
- Most symmetric and tightly clustered.
5. **Run 5 (Black)**:
- Peaks at x=0 with a density of ~0.0007.
- Broad distribution (~-1000 to ~1000 tokens).
- Nearly symmetric but with a flatter peak.
### Key Observations
- All runs show negative differences (Garden Path chains shorter than Non-Garden Path) as the dominant trend, with peaks left of x=0.
- Run 1 has the highest density and widest spread, suggesting greater variability in differences.
- Run 5 is the only run with a peak at x=0, indicating a more balanced distribution of differences.
- The red dotted line at x=0 acts as a visual anchor for comparing deviations.
### Interpretation
The data suggests that Garden Path prompts consistently result in shorter reasoning chains compared to Non-Garden Path prompts across all runs. However, the degree of difference varies:
- **Run 1** exhibits the largest variability, with a broad spread of differences.
- **Run 5** shows the least bias toward negative differences, with a peak at zero, implying more balanced outcomes.
- The gradual shift in peak positions from left (Runs 1-4) to center (Run 5) may reflect methodological adjustments or experimental conditions affecting prompt processing.
- The red reference line highlights that most differences are negative, reinforcing the Garden Path advantage in brevity.
This analysis underscores the importance of prompt design in controlling reasoning chain length, with Run 5’s near-zero peak suggesting potential for optimizing prompt structures to minimize bias.