## Matrix Diagram: Categorical Attribute Visualization
### Overview
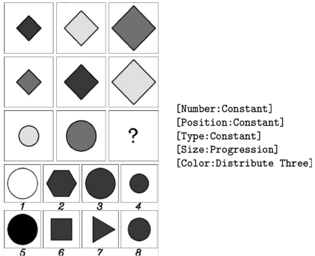
The image displays a 3x3 grid of geometric shapes with embedded labels and a legend. The grid contains 8 labeled cells (1-8) and one cell with a question mark (?). A legend on the right defines color categories, while the left side contains attribute definitions. The visualization combines categorical data (shapes, colors) with progression elements (size, numbering).
### Components/Axes
**Left Labels (Attribute Definitions):**
- [Number:Constant]
- [Position:Constant]
- [Type:Constant]
- [Size:Progression]
- [Color:Distribute Three]
**Legend (Right Side):**
- White (Circle)
- Gray (Diamond)
- Black (Other shapes)
**Grid Structure:**
- 3x3 matrix (9 cells total)
- Bottom row contains numbered cells (1-8) and one cell with "?"
- Top two rows contain unlabeled cells with varying shapes/sizes
### Detailed Analysis
**Grid Content:**
1. **Top Row (Row 1):**
- Cell 1: Small black diamond
- Cell 2: Medium gray diamond
- Cell 3: Large dark gray diamond
2. **Middle Row (Row 2):**
- Cell 4: Small white circle
- Cell 5: Medium gray circle
- Cell 6: Large black diamond
3. **Bottom Row (Row 3):**
- Cell 7: Large white circle
- Cell 8: Medium black hexagon
- Cell 9: Small black circle (marked with "?")
**Legend Correlation:**
- White = Circles (Cells 4, 7)
- Gray = Diamonds (Cells 1, 2, 3, 6)
- Black = Other shapes (Cells 5, 8, 9)
**Size Progression:**
- Small (Cells 1, 4, 9)
- Medium (Cells 2, 5, 8)
- Large (Cells 3, 6, 7)
**Numbering Pattern:**
- Bottom row cells numbered 1-8 sequentially
- Missing number 9 replaced with "?"
### Key Observations
1. **Attribute Consistency:**
- Number, Position, and Type remain constant across all cells
- Size follows a clear progression (small → medium → large)
- Color distributes across three categories (white, gray, black)
2. **Shape Distribution:**
- Diamonds dominate (5/9 cells)
- Circles appear in 3 cells (progression from small to large)
- Hexagon and triangle appear once each
3. **Question Mark Anomaly:**
- Bottom-right cell (position 9) contains "?" instead of a shape
- Suggests missing data or variable element in the sequence
### Interpretation
This visualization appears to demonstrate a categorical matrix with controlled variables:
- **Constants:** Number, Position, and Type remain fixed across all cells
- **Progressive Elements:** Size increases systematically, while Color distributes across three categories
- **Pattern Analysis:** The grid shows a deliberate progression in size (small → medium → large) with consistent shape repetition (diamonds dominate)
- **Anomaly Significance:** The "?" in cell 9 may indicate:
- An incomplete dataset
- A variable element in the progression
- A placeholder for future data
- **Color Distribution:** The three-color system (white/gray/black) creates visual hierarchy while maintaining categorical consistency
The structure suggests this could represent a decision tree, attribute matrix, or categorical progression model where multiple dimensions (shape, size, color) interact under controlled variables.