## Diagram: Reasoning Tree with Preference Data
### Overview
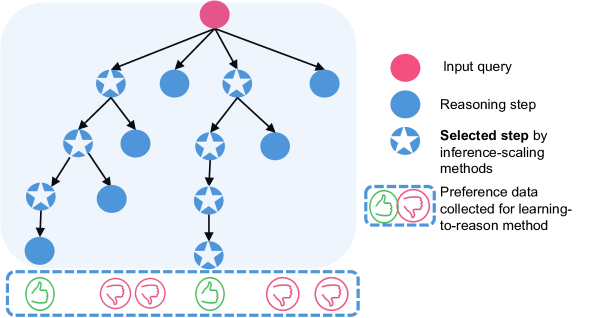
The image depicts a tree diagram illustrating a reasoning process, likely within a machine learning or artificial intelligence context. The tree starts with an "Input query" and branches out into "Reasoning steps," with some steps being "Selected" by inference-scaling methods. Preference data (thumbs up/down) is collected at the end of some branches, presumably for a learning-to-reason method. The diagram is contained within a light blue rounded rectangle.
### Components/Axes
* **Nodes:**
* Pink circle: Represents the "Input query" (located at the top of the tree).
* Blue circle: Represents a "Reasoning step."
* Blue circle with a white star inside: Represents a "Selected step by inference-scaling methods."
* **Edges:** Black arrows indicate the flow of reasoning from one step to the next.
* **Preference Data:**
* Green thumbs-up icon: Represents a positive preference.
* Pink thumbs-down icon: Represents a negative preference.
* These icons are enclosed in dashed-line boxes.
* **Legend:** Located on the right side of the diagram.
* Pink circle: "Input query"
* Blue circle: "Reasoning step"
* Blue circle with a white star: "Selected step by inference-scaling methods"
* Dashed-line box with thumbs-up/down icons: "Preference data collected for learning-to-reason method"
### Detailed Analysis
* **Tree Structure:** The tree originates from the pink "Input query" node at the top. It branches into three paths.
* **Left Branch:** The leftmost branch consists of a "Selected step," followed by another "Selected step," then a "Reasoning step," and finally a "Selected step."
* **Middle Branch:** The middle branch consists of a "Selected step," followed by a "Reasoning step."
* **Right Branch:** The rightmost branch consists of a "Selected step," followed by a "Reasoning step," then a "Selected step," and finally another "Selected step."
* **Preference Data:** Preference data is shown at the bottom of the tree, associated with the end nodes. From left to right, the preferences are: thumbs-up, thumbs-down, thumbs-down, thumbs-up, thumbs-down.
* **Spatial Grounding:** The legend is positioned on the right side of the diagram. The tree structure is primarily located in the center-left portion of the image. The preference data is located at the bottom, spanning the width of the tree.
### Key Observations
* The diagram illustrates a hierarchical reasoning process.
* "Selected steps" are interspersed with regular "Reasoning steps."
* Preference data is collected at the end of some reasoning paths.
* The tree is not balanced, as the branches have different lengths.
### Interpretation
The diagram likely represents a decision-making process where an initial query leads to a series of reasoning steps. The "Selected steps" might indicate steps chosen by a specific algorithm or heuristic. The preference data suggests that the system is learning from feedback, potentially to improve its reasoning process. The imbalance in the tree structure could reflect varying complexities or uncertainties in different reasoning paths. The thumbs up/down icons represent user feedback on the quality or correctness of the reasoning path. This feedback is used to train the learning-to-reason method.