\n
## Diagram: Tree-like Reasoning Process
### Overview
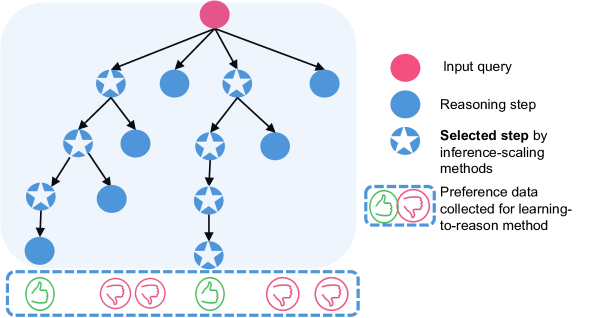
The image depicts a tree-like diagram illustrating a reasoning process, likely within a machine learning or AI context. The diagram shows a branching structure originating from an "Input query" and expanding through "Reasoning steps," with some steps being "Selected" by inference-scaling methods. A section at the bottom indicates "Preference data" collected for a learning-to-reason method.
### Components/Axes
The diagram consists of the following elements:
* **Input query:** Represented by a pink circle at the top of the tree.
* **Reasoning step:** Represented by blue circles.
* **Selected step by inference-scaling methods:** Represented by blue circles with a white star inside.
* **Preference data:** Represented by a dashed rectangle containing green checkmark and red cross icons.
* **Legend:** Located in the top-right corner, defining the meaning of the different circle colors and star symbols.
* **Background:** A light blue shaded area encompassing the entire tree structure.
### Detailed Analysis or Content Details
The diagram shows a tree structure with the following characteristics:
1. **Root Node:** The "Input query" (pink circle) is at the very top.
2. **First Level:** The input query branches into four "Reasoning steps" (blue circles).
3. **Second Level:** Each of the four reasoning steps branches into two more "Reasoning steps" (blue circles).
4. **Third Level:** Each of the eight reasoning steps branches into two more "Reasoning steps" (blue circles).
5. **Fourth Level:** Each of the sixteen reasoning steps branches into two more "Reasoning steps" (blue circles).
6. **Selection:** Within each level, some of the "Reasoning steps" are marked as "Selected" (blue circle with a white star). The selection pattern appears somewhat random, but is not fully uniform.
7. **Preference Data:** At the bottom, a dashed rectangle contains five icons: a green checkmark, a red cross, a green checkmark, a red cross, and a red cross. These represent preference data collected for the learning-to-reason method.
The diagram does not contain numerical data or precise measurements. It is a visual representation of a process.
### Key Observations
* The tree structure demonstrates a hierarchical decomposition of the input query into a series of reasoning steps.
* The selection of specific reasoning steps suggests a filtering or prioritization process.
* The preference data indicates a feedback mechanism for improving the reasoning process.
* The diagram is symmetrical in its branching structure.
### Interpretation
The diagram illustrates a method for solving a problem or answering a query through a series of reasoning steps. The "Input query" is broken down into smaller, more manageable steps. The "inference-scaling methods" select the most promising steps to pursue, and the "Preference data" is used to refine the selection process over time. This suggests a learning-to-reason approach, where the system learns to identify the most effective reasoning paths through feedback. The diagram highlights the iterative and exploratory nature of the reasoning process. The branching structure suggests that multiple reasoning paths are explored simultaneously, and the selection mechanism helps to focus on the most promising ones. The preference data provides a signal for learning which reasoning paths are more likely to lead to successful outcomes. The diagram is a conceptual illustration and does not provide specific details about the algorithms or techniques used. It is a high-level overview of a reasoning process.