## Flowchart: Inference-Scaling Method for Reasoning Steps
### Overview
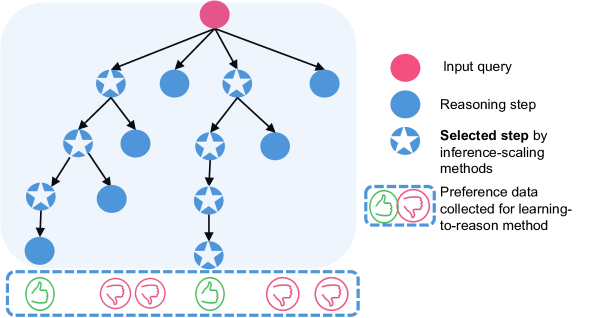
The flowchart illustrates a hierarchical decision-making process for selecting reasoning steps in an inference-scaling method. It begins with an input query (red node) and branches into multiple reasoning steps (blue nodes), with selected steps marked by stars (blue-starred nodes). Preference data (green thumbs-up/red thumbs-down icons) is collected at the bottom to refine the learning-to-reason method.
### Components/Axes
- **Legend**:
- Red circle: Input query
- Blue circle: Reasoning step
- Blue circle with star: Selected step by inference-scaling methods
- Green thumbs-up: Positive preference data
- Red thumbs-down: Negative preference data
- **Flow Structure**:
- Hierarchical tree with arrows indicating progression from input query to reasoning steps.
- Selected steps (starred nodes) are distributed across branches.
- Preference data icons are grouped at the bottom, separated by dashed lines.
### Detailed Analysis
- **Input Query**: Single red node at the top center, acting as the root of the decision tree.
- **Reasoning Steps**:
- 12 blue nodes (reasoning steps) distributed across 4 primary branches.
- Each primary branch splits into 2–3 secondary branches, with 1–2 reasoning steps per branch.
- **Selected Steps**:
- 5 blue-starred nodes (selected steps) are positioned at varying depths in the tree.
- Examples:
- One at the first split of the leftmost branch.
- Two at the second split of the middle branches.
- Two at the terminal nodes of the rightmost branch.
- **Preference Data**:
- 5 icons at the bottom: 3 green thumbs-up (positive feedback) and 2 red thumbs-down (negative feedback).
- Dashed lines separate the preference data from the reasoning steps.
### Key Observations
1. **Hierarchical Complexity**: The tree has 4 primary branches, each with 2–3 secondary splits, creating a total of 12 reasoning steps.
2. **Selection Distribution**: Selected steps (starred nodes) are not uniformly distributed; they appear more frequently in the middle and terminal nodes.
3. **Feedback Asymmetry**: Positive feedback (green thumbs-up) outnumbers negative feedback (red thumbs-down) by a ratio of 3:2.
### Interpretation
This flowchart represents a system where an input query is processed through a series of reasoning steps, with some steps prioritized (starred) based on inference-scaling criteria. The collected preference data (thumbs-up/down) suggests a feedback loop to refine the selection algorithm. The asymmetry in feedback implies the system may favor certain reasoning paths over others, potentially biasing the learning-to-reason method toward more "approved" steps. The hierarchical structure indicates a multi-stage evaluation process, where early reasoning steps influence later ones, and user feedback is used to iteratively improve the selection logic.