## Scatter Plot: Pretraining vs Downstream Performance
### Overview
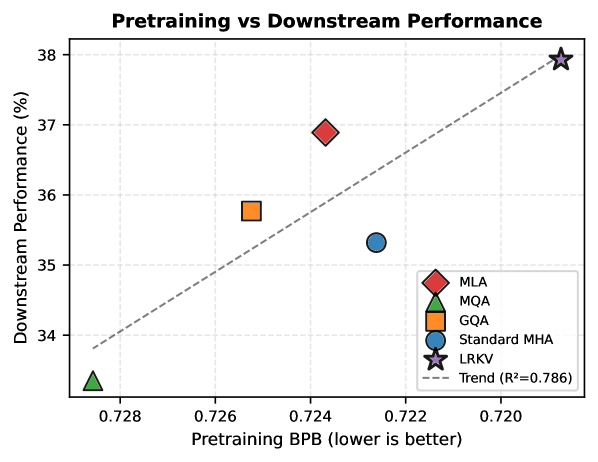
The image is a scatter plot comparing **Pretraining BPB (Bits Per Byte, lower is better)** on the x-axis and **Downstream Performance (%)** on the y-axis. Data points represent different models/methods, with a dashed trend line indicating a negative correlation (R²=0.786). The legend maps symbols/colors to specific models.
---
### Components/Axes
- **Title**: "Pretraining vs Downstream Performance" (top center).
- **X-axis**: "Pretraining BPB (lower is better)" with values ranging from ~0.720 to 0.728.
- **Y-axis**: "Downstream Performance (%)" with values from ~33.5% to 38%.
- **Legend**: Located in the bottom-right corner, with the following mappings:
- **Red Diamond**: MLA
- **Green Triangle**: MQA
- **Orange Square**: GQA
- **Blue Circle**: Standard MHA
- **Purple Star**: LRKV
- **Dashed Line**: Trend (R²=0.786).
---
### Detailed Analysis
#### Data Points
1. **MQA (Green Triangle)**:
- X: 0.728 (highest Pretraining BPB).
- Y: ~33.5% (lowest Downstream Performance).
2. **GQA (Orange Square)**:
- X: 0.726.
- Y: ~35.8%.
3. **Standard MHA (Blue Circle)**:
- X: 0.722.
- Y: ~35.3%.
4. **MLA (Red Diamond)**:
- X: 0.724.
- Y: ~36.9%.
5. **LRKV (Purple Star)**:
- X: 0.720 (lowest Pretraining BPB).
- Y: ~38.0% (highest Downstream Performance).
#### Trend Line
- A **dashed line** slopes **upward** from left to right, indicating a **negative correlation** between Pretraining BPB and Downstream Performance (R²=0.786). This suggests that lower Pretraining BPB values are associated with higher downstream performance.
---
### Key Observations
1. **LRKV (Purple Star)** is the most efficient model, achieving the lowest Pretraining BPB (0.720) and highest Downstream Performance (38.0%).
2. **MQA (Green Triangle)** is the least efficient, with the highest Pretraining BPB (0.728) and lowest Downstream Performance (33.5%).
3. The trend line confirms a strong inverse relationship (R²=0.786), meaning Pretraining BPB is a significant predictor of downstream performance.
4. **Standard MHA (Blue Circle)** and **GQA (Orange Square)** fall in the middle, with moderate Pretraining BPB and performance.
---
### Interpretation
The data demonstrates that **Pretraining BPB is a critical factor** in determining downstream performance. Models with lower Pretraining BPB (e.g., LRKV) outperform those with higher values (e.g., MQA). The trend line’s high R² value (0.786) underscores the robustness of this relationship.
- **LRKV** stands out as the optimal model, suggesting it may employ more efficient pretraining strategies.
- **MQA**’s poor performance highlights potential inefficiencies in its pretraining process.
- The scatter plot implies that optimizing Pretraining BPB could significantly improve downstream outcomes, making it a key metric for model evaluation.
This analysis aligns with the goal of identifying models that balance computational efficiency (low BPB) with high performance, guiding future research or deployment decisions.