## Line Chart: Gemma-2B-IT-Chat Loss vs. Epoch
### Overview
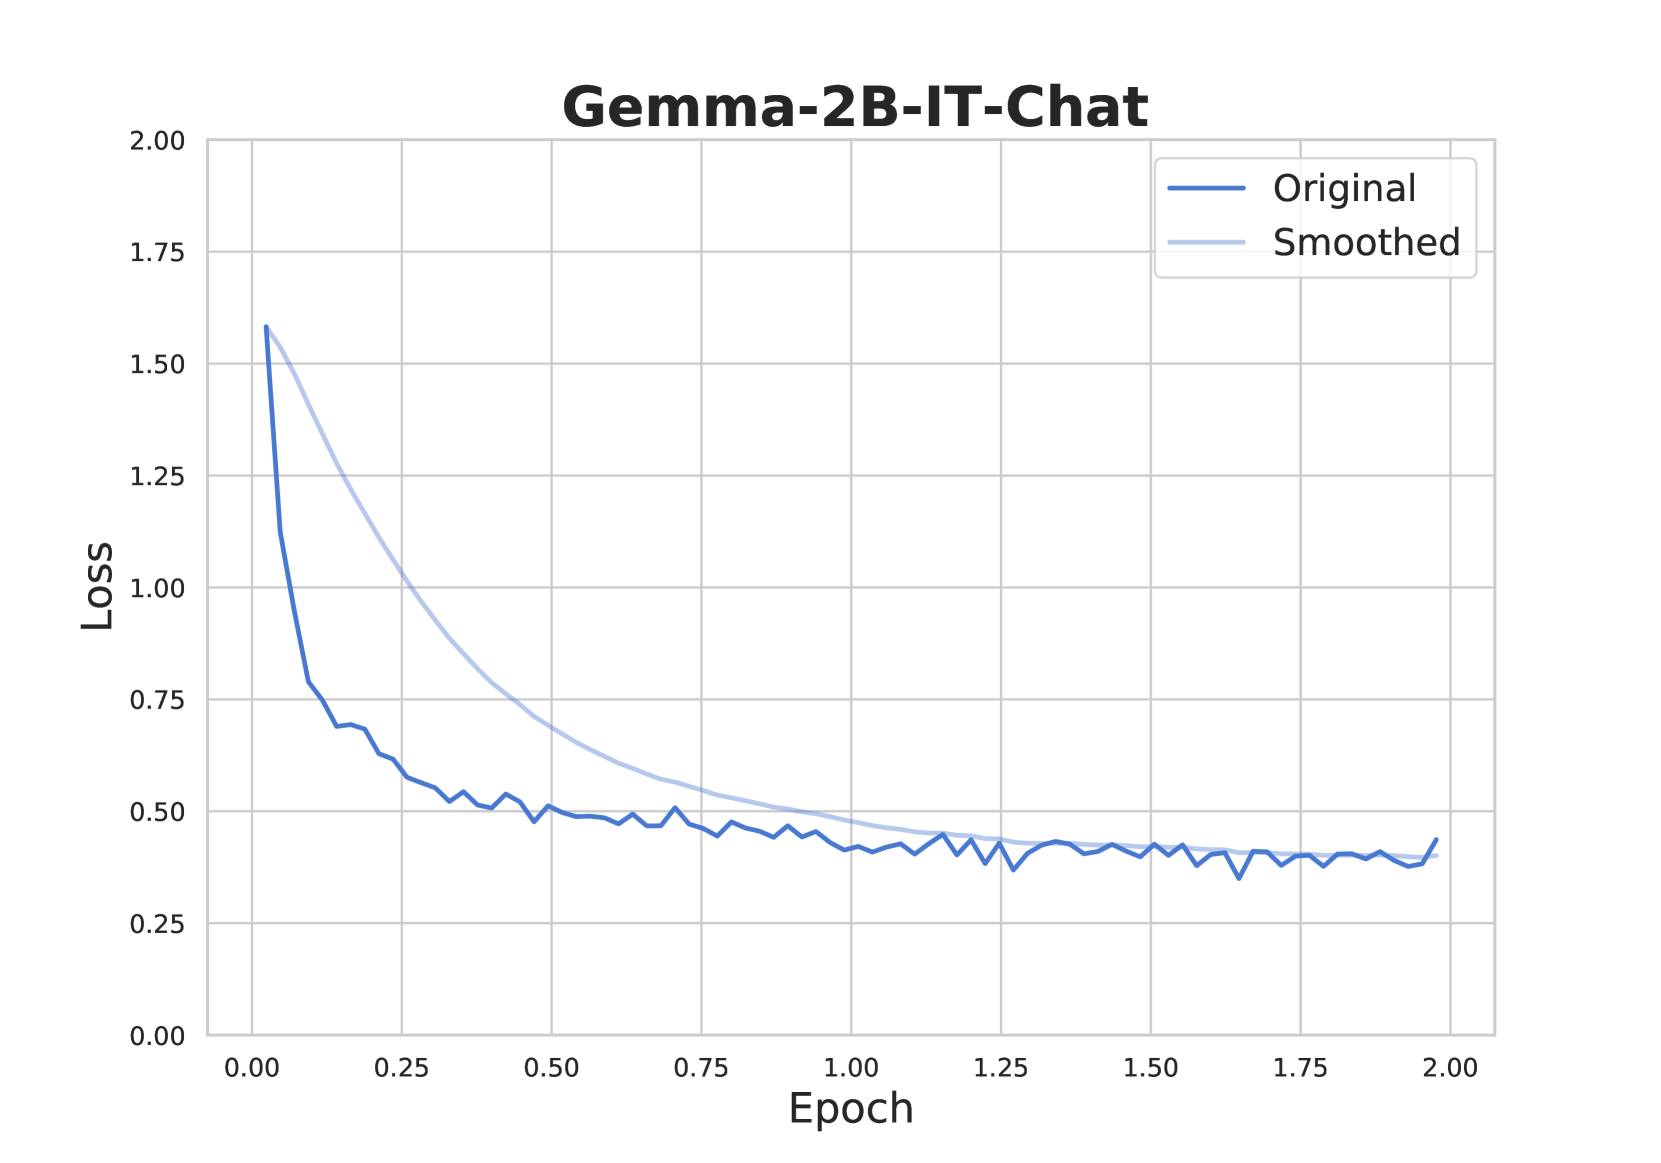
The image is a line chart displaying the loss of the Gemma-2B-IT-Chat model during training, plotted against the number of epochs. Two lines are shown: the "Original" loss and a "Smoothed" version of the loss. The chart illustrates how the loss decreases over time, indicating the model's learning progress.
### Components/Axes
* **Title:** Gemma-2B-IT-Chat
* **X-axis:** Epoch
* Scale: 0.00 to 2.00, with increments of 0.25
* **Y-axis:** Loss
* Scale: 0.00 to 2.00, with increments of 0.25
* **Legend:** Located in the top-right corner of the chart.
* **Original:** Represented by a solid dark blue line.
* **Smoothed:** Represented by a light blue line.
### Detailed Analysis
* **Original Loss (Dark Blue):**
* Trend: The original loss decreases rapidly from approximately 1.6 at epoch 0 to around 0.75 at epoch 0.25. It continues to decrease, but at a slower rate, fluctuating around 0.5 until approximately epoch 0.75. From epoch 0.75 to 2.00, the loss fluctuates around 0.4, showing minimal decrease.
* Data Points:
* Epoch 0.00: Loss ~ 1.6
* Epoch 0.25: Loss ~ 0.75
* Epoch 0.50: Loss ~ 0.55
* Epoch 0.75: Loss ~ 0.50
* Epoch 1.00: Loss ~ 0.48
* Epoch 1.25: Loss ~ 0.42
* Epoch 1.50: Loss ~ 0.42
* Epoch 1.75: Loss ~ 0.40
* Epoch 2.00: Loss ~ 0.42
* **Smoothed Loss (Light Blue):**
* Trend: The smoothed loss also decreases rapidly from approximately 1.6 at epoch 0, but the decrease is more gradual compared to the original loss. It decreases to approximately 0.6 at epoch 0.75 and continues to decrease slowly, reaching around 0.45 at epoch 2.00.
* Data Points:
* Epoch 0.00: Loss ~ 1.6
* Epoch 0.25: Loss ~ 1.1
* Epoch 0.50: Loss ~ 0.8
* Epoch 0.75: Loss ~ 0.6
* Epoch 1.00: Loss ~ 0.52
* Epoch 1.25: Loss ~ 0.48
* Epoch 1.50: Loss ~ 0.46
* Epoch 1.75: Loss ~ 0.45
* Epoch 2.00: Loss ~ 0.45
### Key Observations
* The "Original" loss fluctuates more than the "Smoothed" loss, as expected.
* Both lines show a significant decrease in loss during the initial epochs (0 to 0.75), indicating effective learning.
* After epoch 0.75, the decrease in loss becomes minimal, suggesting that the model is approaching convergence.
* The smoothed loss is consistently higher than the original loss, especially in the early epochs.
### Interpretation
The chart illustrates the training progress of the Gemma-2B-IT-Chat model. The rapid decrease in loss during the initial epochs indicates that the model is quickly learning to minimize the error between its predictions and the actual values. The "Smoothed" loss provides a clearer view of the overall trend by reducing the impact of short-term fluctuations in the "Original" loss. The convergence of both lines towards a stable loss value suggests that the model has learned the underlying patterns in the data and is no longer making significant improvements with each epoch. The fluctuations in the original loss after epoch 0.75 could be due to noise in the data or the model's sensitivity to specific training examples. Overall, the chart indicates that the model has been trained effectively and has achieved a reasonable level of performance.