## Line Chart: Gemma-2B-IT-Chat Loss vs. Epoch
### Overview
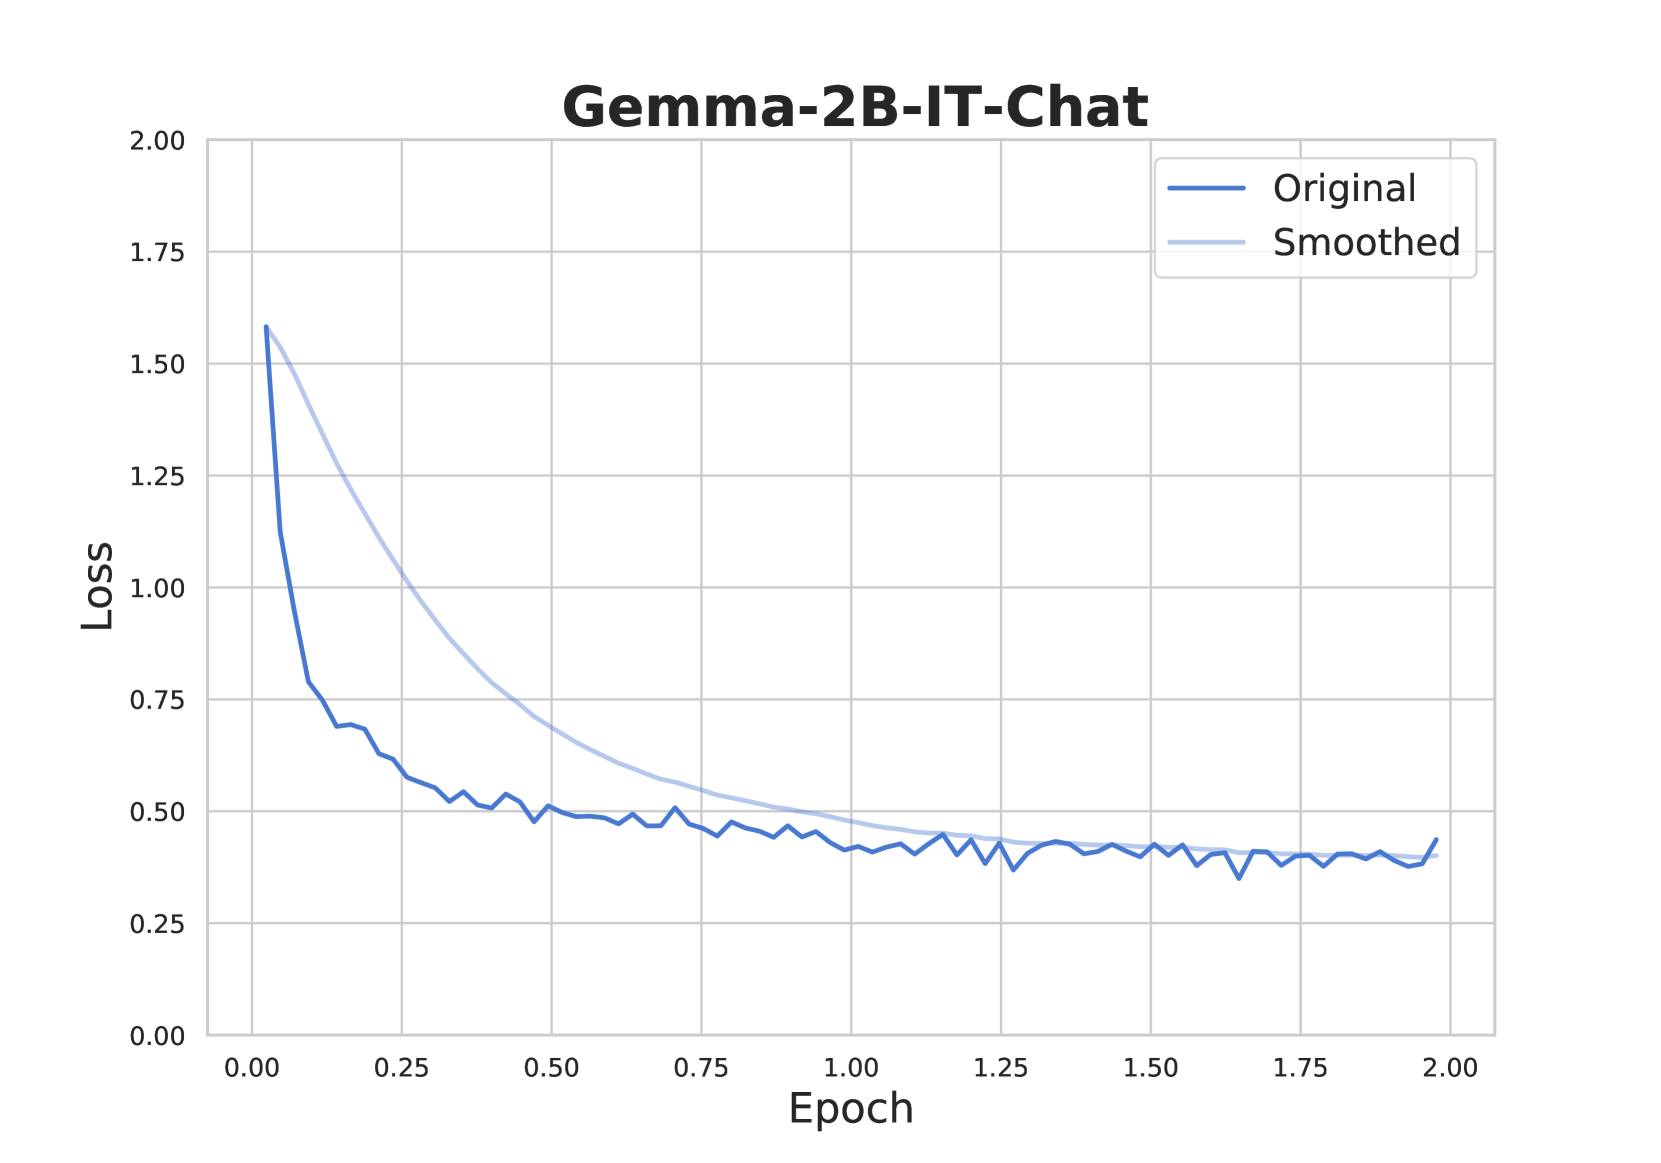
This image presents a line chart illustrating the relationship between 'Loss' and 'Epoch' during the training of the Gemma-2B-IT-Chat model. Two lines are plotted: 'Original' and 'Smoothed', representing the loss function's behavior over training epochs. The chart aims to visualize the model's learning progress and stability.
### Components/Axes
* **Title:** Gemma-2B-IT-Chat
* **X-axis:** Epoch (ranging from approximately 0.00 to 2.00)
* **Y-axis:** Loss (ranging from approximately 0.00 to 2.00)
* **Legend:**
* 'Original' - Dark Blue Line
* 'Smoothed' - Light Blue Line
### Detailed Analysis
The chart displays two lines representing the loss function over epochs.
**Original Line (Dark Blue):**
The 'Original' line starts at approximately 1.60 Loss at Epoch 0.00. It exhibits a steep downward trend until approximately Epoch 0.25, where the Loss reaches around 0.60. From Epoch 0.25 to Epoch 1.00, the line continues to decrease, but at a slower rate, reaching a minimum Loss of approximately 0.35 at Epoch 0.75. After Epoch 1.00, the line fluctuates between approximately 0.35 and 0.50, showing some instability. At Epoch 2.00, the Loss is approximately 0.40.
**Smoothed Line (Light Blue):**
The 'Smoothed' line begins at approximately 1.60 Loss at Epoch 0.00, mirroring the 'Original' line. It also shows a rapid decrease initially, reaching around 0.70 Loss at Epoch 0.25. The line continues to decline, leveling off around 0.40 Loss between Epochs 0.50 and 1.50. From Epoch 1.50 to Epoch 2.00, the line shows a slight increase, ending at approximately 0.45 Loss.
**Data Points (Approximate):**
| Epoch | Original Loss | Smoothed Loss |
|-------|--------------|--------------|
| 0.00 | 1.60 | 1.60 |
| 0.25 | 0.60 | 0.70 |
| 0.50 | 0.45 | 0.40 |
| 0.75 | 0.35 | 0.35 |
| 1.00 | 0.40 | 0.40 |
| 1.25 | 0.45 | 0.40 |
| 1.50 | 0.40 | 0.45 |
| 1.75 | 0.40 | 0.45 |
| 2.00 | 0.40 | 0.45 |
### Key Observations
* Both lines demonstrate a decreasing trend in Loss, indicating that the model is learning over time.
* The 'Smoothed' line provides a more stable representation of the learning process, reducing the impact of short-term fluctuations.
* The 'Original' line exhibits more volatility after Epoch 1.00, suggesting potential overfitting or instability in the training process.
* The loss appears to converge to a value around 0.40-0.45.
### Interpretation
The chart illustrates the training dynamics of the Gemma-2B-IT-Chat model. The initial steep decline in Loss indicates rapid learning in the early stages of training. The subsequent leveling off and fluctuations suggest that the model is approaching a point of convergence, but may be experiencing some instability. The 'Smoothed' line helps to visualize the overall trend, filtering out noise and providing a clearer picture of the model's learning progress. The convergence around a loss of 0.40-0.45 suggests that the model has reached a reasonable level of performance on the training data. The fluctuations in the 'Original' line after Epoch 1.00 could indicate the need for regularization techniques or further hyperparameter tuning to prevent overfitting and improve generalization. The chart is a standard visualization for monitoring the training process of machine learning models, providing insights into their learning behavior and potential issues.