## Line Chart: Gemma-2B-IT-Chat Training Loss
### Overview
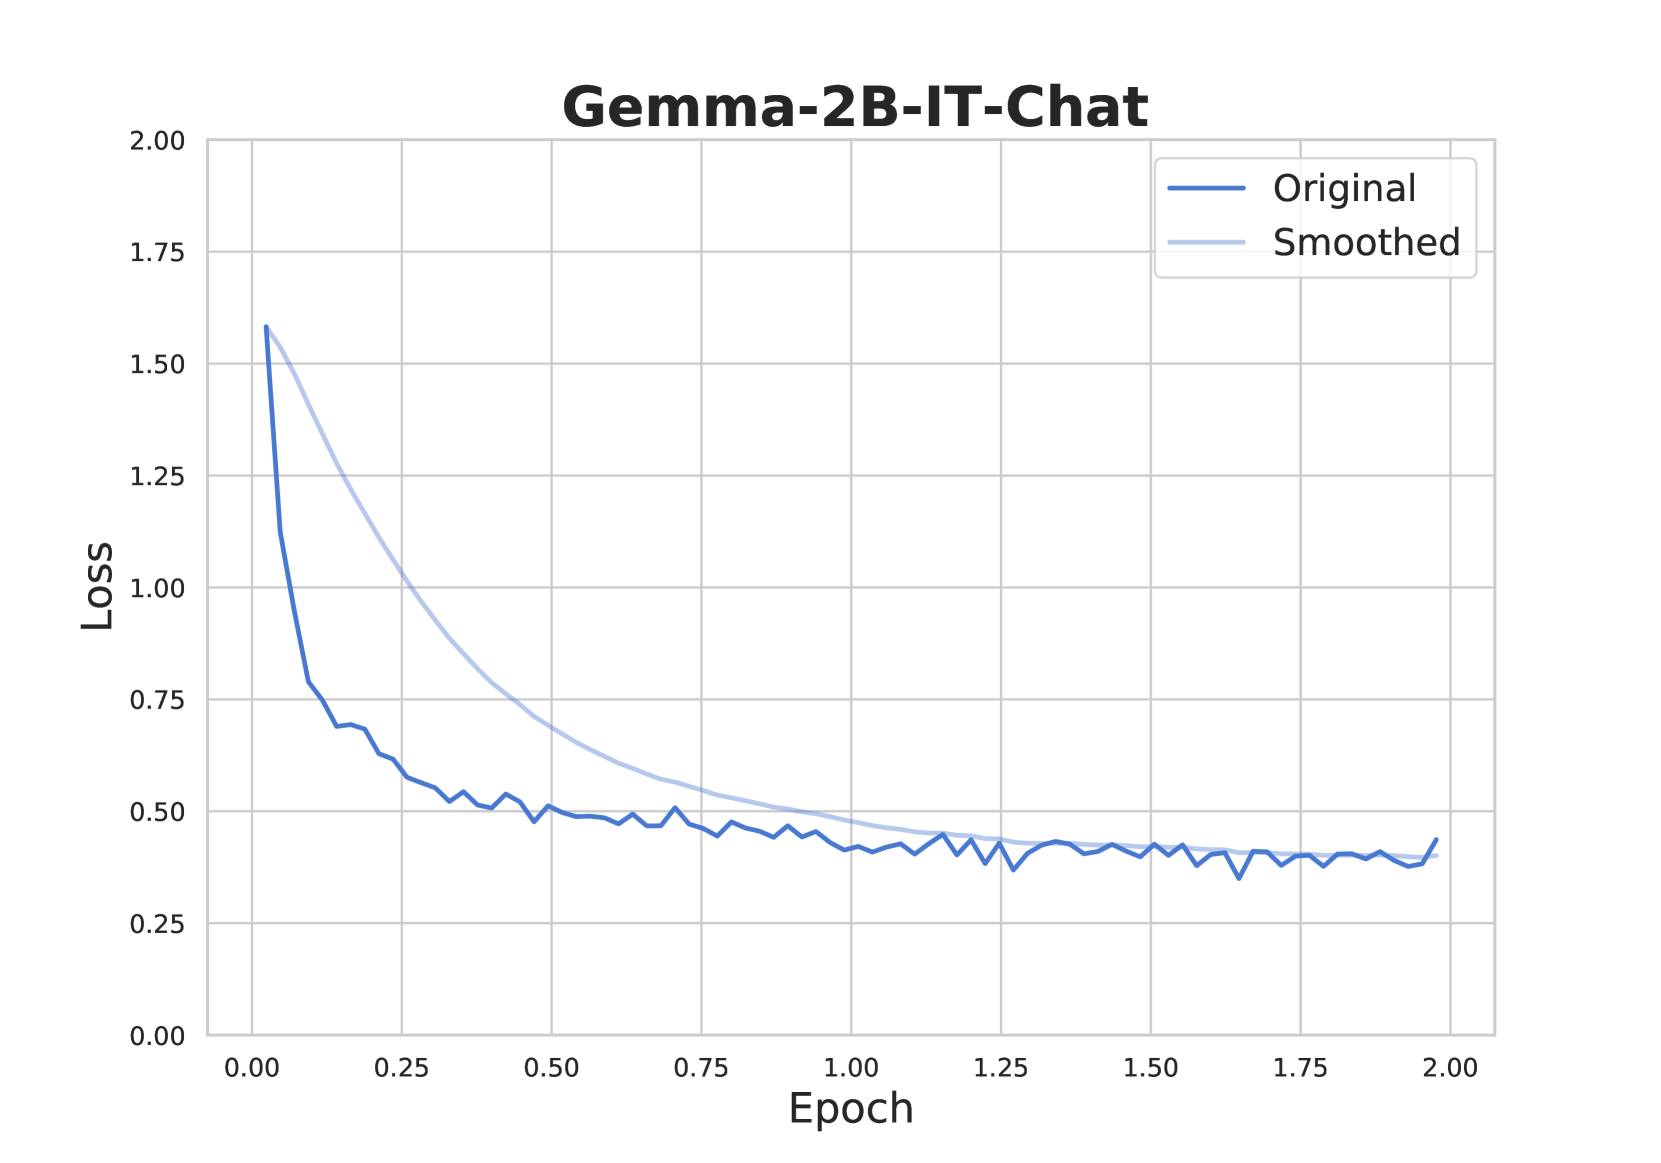
This image is a line chart titled "Gemma-2B-IT-Chat," displaying the training loss of a machine learning model over a period of 2 epochs. The chart plots two data series: the raw, fluctuating loss values ("Original") and a smoothed version of the same data ("Smoothed").
### Components/Axes
* **Title:** "Gemma-2B-IT-Chat" (centered at the top).
* **Y-Axis:** Labeled "Loss." The scale runs from 0.00 to 2.00, with major gridlines and labels at intervals of 0.25 (0.00, 0.25, 0.50, 0.75, 1.00, 1.25, 1.50, 1.75, 2.00).
* **X-Axis:** Labeled "Epoch." The scale runs from 0.00 to 2.00, with major gridlines and labels at intervals of 0.25 (0.00, 0.25, 0.50, 0.75, 1.00, 1.25, 1.50, 1.75, 2.00).
* **Legend:** Located in the top-right corner of the plot area. It contains two entries:
* A dark blue line labeled "Original."
* A light blue line labeled "Smoothed."
* **Grid:** A light gray grid is present, aligning with the major ticks on both axes.
### Detailed Analysis
**Data Series & Trends:**
1. **Original (Dark Blue Line):**
* **Trend:** Shows a steep, rapid descent initially, followed by a gradual, noisy decline that eventually plateaus.
* **Key Data Points (Approximate):**
* Epoch 0.00: Loss ≈ 1.58 (starting point).
* Epoch 0.10: Loss ≈ 0.80 (sharp drop).
* Epoch 0.25: Loss ≈ 0.60.
* Epoch 0.50: Loss ≈ 0.50.
* Epoch 1.00: Loss ≈ 0.40.
* Epoch 1.50: Loss ≈ 0.38.
* Epoch 2.00: Loss ≈ 0.42 (slight uptick at the very end).
* **Behavior:** The line exhibits significant high-frequency noise or volatility throughout, with many small peaks and valleys, especially visible after epoch 0.5.
2. **Smoothed (Light Blue Line):**
* **Trend:** Shows a smooth, continuous, and monotonic decrease, representing the underlying trend of the "Original" data without the noise.
* **Key Data Points (Approximate):**
* Epoch 0.00: Loss ≈ 1.58 (coincides with Original).
* Epoch 0.25: Loss ≈ 1.05.
* Epoch 0.50: Loss ≈ 0.70.
* Epoch 0.75: Loss ≈ 0.55.
* Epoch 1.00: Loss ≈ 0.48.
* Epoch 1.50: Loss ≈ 0.40.
* Epoch 2.00: Loss ≈ 0.38.
* **Behavior:** This line acts as a trendline, clearly illustrating the exponential-decay-like pattern of the loss function. It converges with the general level of the "Original" line after epoch 1.0.
### Key Observations
* **Rapid Initial Convergence:** The most dramatic reduction in loss occurs within the first 0.25 epochs, where the loss drops by over 60% from its starting value.
* **Noise Profile:** The "Original" signal is consistently noisy, indicating high variance in the per-step or per-batch loss calculations during training.
* **Plateau Phase:** After approximately epoch 1.0, the rate of loss reduction slows significantly. The loss value stabilizes in the range of 0.35 to 0.45 for the remainder of the charted training.
* **Final Uptick:** There is a minor but noticeable increase in the "Original" loss at the final data point (epoch 2.00), which could be statistical noise or the beginning of overfitting, though more data would be needed to confirm.
### Interpretation
This chart visualizes the training dynamics of the "Gemma-2B-IT-Chat" model. The steep initial descent indicates that the model is learning very effectively at the start of training, quickly adjusting its parameters to reduce prediction error. The subsequent plateau suggests the model is approaching a local minimum in the loss landscape, where further improvements become incremental.
The presence of the "Smoothed" line is crucial for interpretation. It filters out the stochastic noise inherent in mini-batch gradient descent, revealing the true, underlying learning trajectory. The fact that the smoothed loss continues a gentle downward trend even in the plateau phase (from ~0.48 at epoch 1.0 to ~0.38 at epoch 2.0) suggests that training is still beneficial, albeit at a much slower pace. The final uptick in the raw loss warrants monitoring in subsequent epochs to ensure it is not a sign of training instability or overfitting. Overall, the chart demonstrates a healthy and typical loss curve for a well-configured training run.